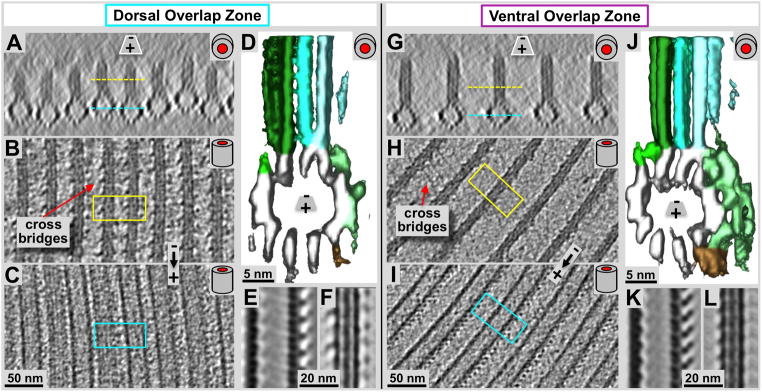
Figure 6. Detailed cryo-electron tomography 3-D analysis of the microtubule-microribbon complexes within the Giardia ventral disc overlap zones.
Panels A and G are microtubule end-on views (~20 nm tomographic xz-slices) of the dorsal (A) and ventral (G) overlap zones. B & C, and H & I are 2.8 nm slices through the microribbons (B & H) and through the microtubules (C & I) respectively. Yellow and cyan lines in A & G mark the equivalent zones in B & C, as well as H & I. Volume averaging produced in the surface rendered 3-D maps are shown in D & J. Panels E & F (dorsal), and K & L (ventral) show 0.77 nm slices through averaged microtubule (E & K) and microribbon portions (F & L). The most obvious differences between ventral (D–F) and dorsal (J–L) overlap zones are the much larger amounts of associated protein densities in the case of the ventral microtubule-microribbon complexes (D & E) that revealed a similar pattern of associated proteins as previously found in the disc body (pale green (sidearms) and brown (paddles) rendered densities; see also Fig. 6C and Schwartz et al., 2012). The dorsal overlap zone microtubules, however, shows much less associated density (E & F), which could be a consequence of the denser lateral packing of the microtubule-microribbon complexes (compare panel A with F).

