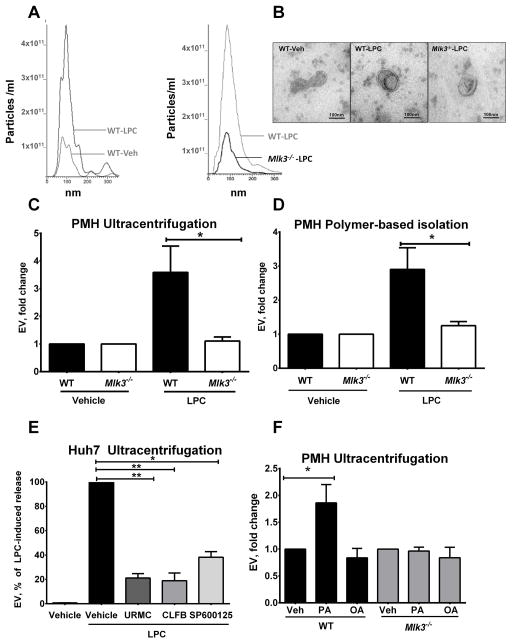
Figure 1. LPC-induced EV generation is MLK3-dependent.
(A) Representative images of nanoparticle tracking analysis (NTA) profile for particle size per concentration of extracellular vesicles (EVs) released from vehicle & lysophosphatidylcholine (LPC)-treated primary mouse hepatocytes (PMH) from wild type (WT) (left panel) & mixed lineage kinase (Mlk3)−/− mice (right panel). (B) Representative transmission electron photomicrograph of EVs derived from vehicle and LPC-treated WT PMH and LPC-treated Mlk3−/− PMH, and isolated by ultracentrifugation. Fold increase above vehicle in EVs release by WT and Mlk3−/− PMH treated with 20 μM LPC for 4 hour, and isolated by (C) ultracentrifugation or (D) by polymer based isolation using a commercially available kit, and quantified by NTA. (E) Huh7 cells were treated with vehicle, or 20 μM LPC with or without 1 μM of one of the MLK3 inhibitors URMC099 (URMC), and CLFB1134 (CLFB), or 20 μM of C-JUN N-terminal kinase (JNK) inhibitor SP600125. EVs were isolated by ultracentrifugation, quantified using NTA, and expressed as percentage of induced LPC release. (F) PMH were treated with OA and PA (both 400 μM for 16 hours), EVs were isolated by ultracentrifugation, and quantified using NTA. Bar columns represent mean ± S.E.M. ** P < .01, * P < .05 compared to vehicle treatment

