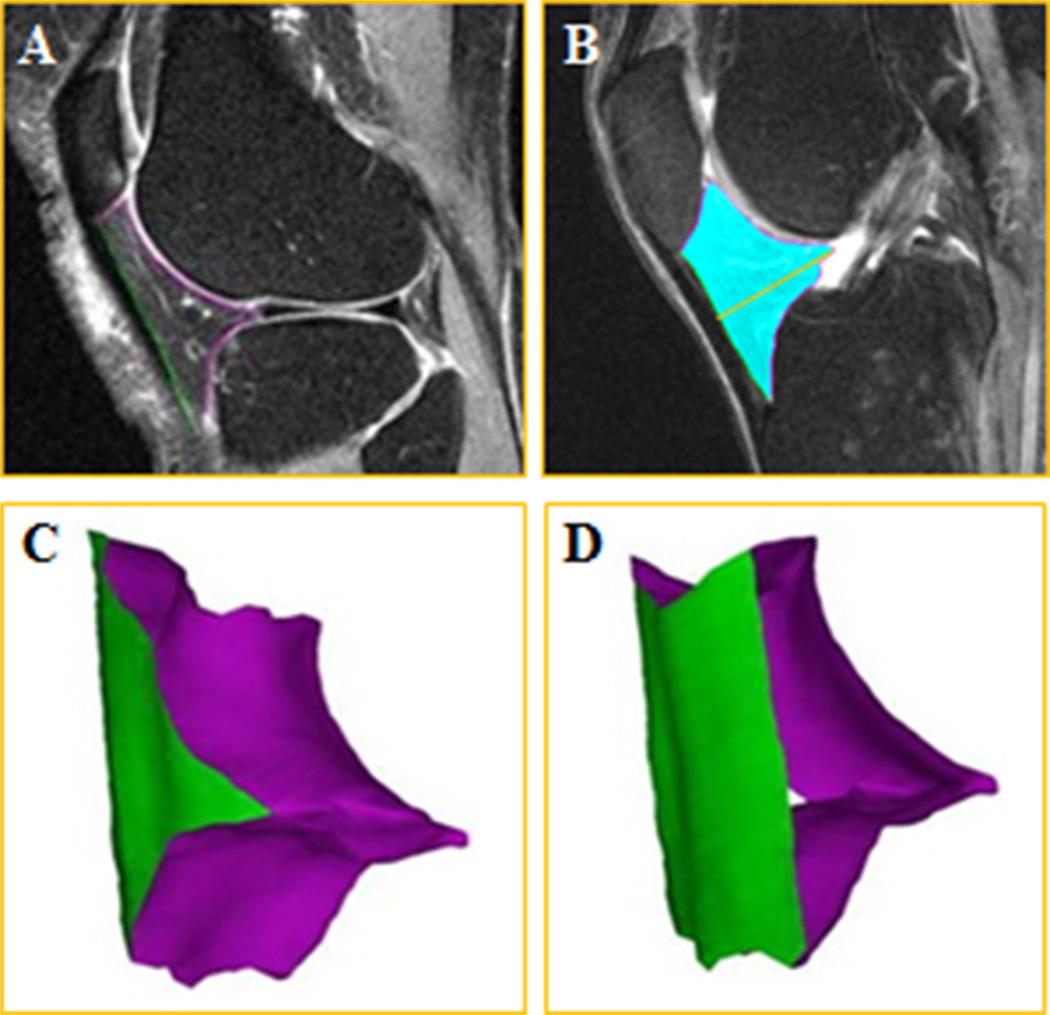
Fig. 2. Illustration of the infra-patellar fat pad segmentation and 3D reconstruction.
(A) Sagittal fat-suppressed MRI of the knee joint showing segmentation of the anterior surface (green label), and posterior surface (magenta label) of the IPFP, (B) IPFP volume (blue) and depth (orange line), (C) 3D reconstruction of the IPFP viewed from posterior-lateral and (D) from anterior-lateral. (For interpretation of the references to color in this figure legend, the reader is referred to the web version of this article.)

