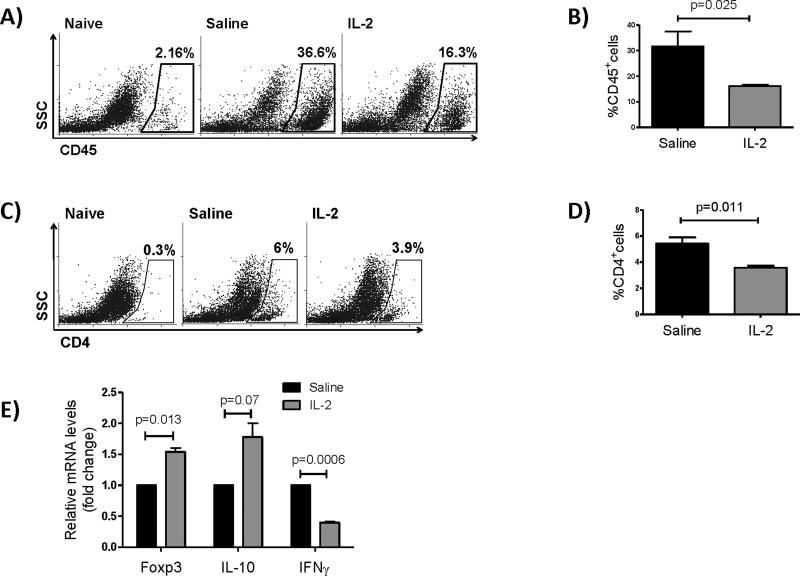
Figure 3. Low-dose IL-2 treatment decreases corneal infiltration of leukocytes.
Two weeks post-transplantation corneas of IL-2–treated and control mice (naïve BALB/c mice without transplantation and saline-treated mice) were collected and analyzed for their expression of CD45 and CD4. (A, B) Representative flow dot plots and bar graphs showing frequencies of CD45+ leukocytes. (C, D) Representative flow dot plots and bar graphs showing frequencies of CD4+ T cells. (E) Relative changes in mRNA levels of IL-10, Foxp3 and IFNγ in corneal tissues at two weeks after transplantation (Bar graphs show mean ± SD, N=4 mice/group, data represents results of three independent experiments).

