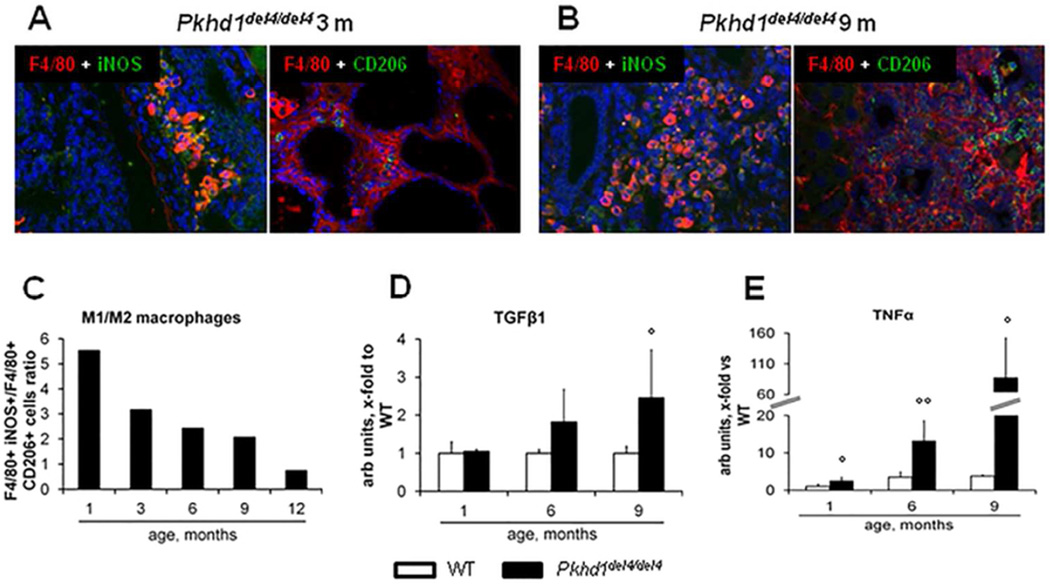
Figure 3. The initial M1 macrophage infiltrate is then matched by M2 cells.
A–B. By dual immunofluorescence with the macrophage marker F4/80 (red), we evaluated the relative proportion of the macrophage phenotypes in the portal infiltrate, M1 (iNOS+, green) and M2 (CD206+, green), through the different ages (A, representative sample, 3 months; B, representative sample, 9 months, M=200×). C. Until the 9th month, the macrophage population was dominated by the M1 phenotype, but the relative proportion of M2 macrophages increased progressively, reaching that of M1 at the 12th month, as shown by the changes in the M1/M2 ratio through maturation (n=3 for each age). D. Consistent with this temporal sequence, gene expression of TGFβ1 (an M2 cytokine) in the whole liver increased mildly in the first phase, becoming significant only at 9 months (2.5-folds with respect to WT) (n=3 for each age). E. Up-regulation of TNFα (an M1 cytokine) was instead evident since the early stage of the disease, reaching 80-fold expression with respect to WT livers at 9 months (n=3 for each age). °p<0.05 vs WT (1 month), °°p<0.01 vs WT (1 month).

