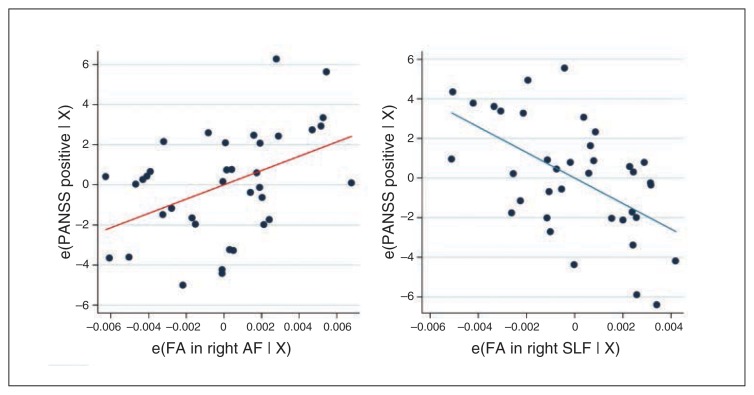
Fig. 2.
Added-variable plots between residuals of baseline Positive and Negative Syndrome Scale (PANSS) positive scores and fractional anisotropy (FA) within the right arcuate fasciculus (AF) and right superior longitudinal fasciculus (SLF) after adjusting for all other predictors. (A) The scatter plot of the residuals shows positive correlation between the right AF and PANSS positive scores (red regression line). (B) The scatter plot of the residuals shows negative correlation between the right SLF and PANSS positive scores (blue regression line). e(FA in right AF | X) = residuals after fitting the reduced model (model without FA in the AF) to FA in the AF; e(FA in right SLF | X) = residuals after fitting the reduced model (model without FA in the SLF) to FA in the SLF; e(PANSS positive | X) = residuals after fitting the reduced model (model without FA in the AF/SLF) to PANSS positive scores.

