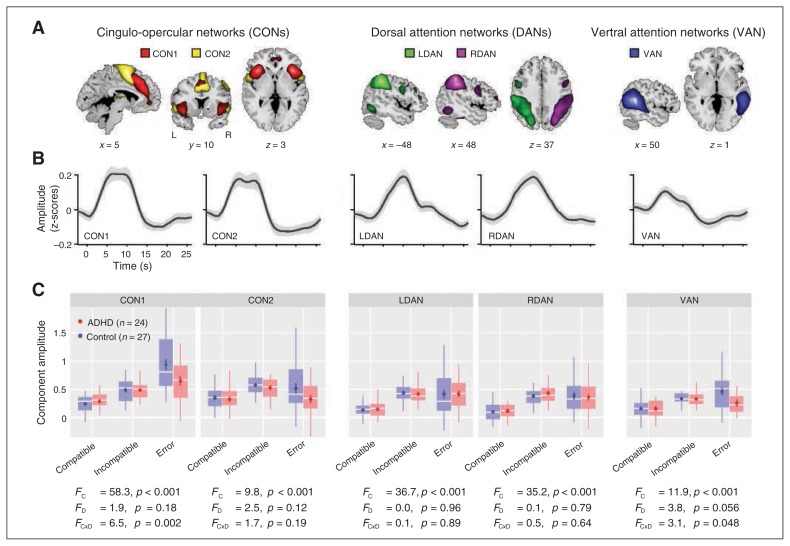
Fig. 2.
Component activation to different task conditions. (A) Component maps of cingulo-opercular networks (CONs; left), dorsal attention networks (DANs; middle) and the right-lateralized ventral attention network (VAN; right). Component t maps are thresholded at t > 8 (1-sample t test) and displayed at the most informative slices. See Table 1 for peak coordinates and cluster extents of each component. (B) Average hemodynamic response functions (HRFs) were estimated from incompatible trials, the condition that evoked the strongest response for these components (see Methods section). Error bands indicate ± 1 SEM. (C) Component amplitudes to compatible, incompatible and error trials as a function of group (attention-deficit/hyperactivity [ADHD] = red; control = blue). Repeated-measures analysis of variance F statistics for Flanker compatibility, diagnosis, and their interaction are provided as FC2,98, FD1,98 and FC × D2,98, respectively.

