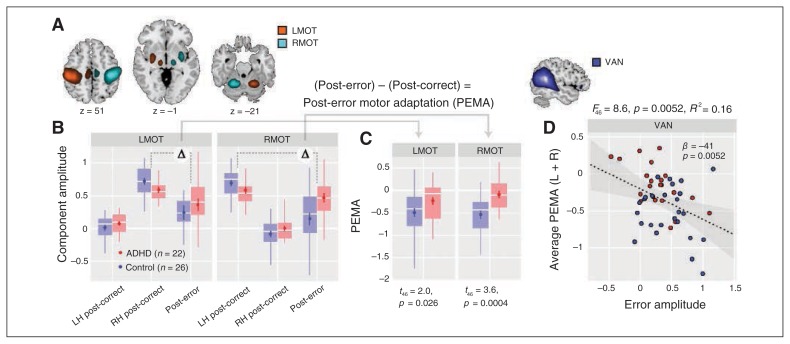
Fig. 4.
Post-error motor adaption (PEMA) and its association with the ventral attention network (VAN). (A) Component maps of lateralized left and right motor (MOT) systems. Component t maps are thresholded at t > 8 (1-sample t test) and displayed at the most informative slices. See Table 1 for peak coordinates and cluster extents of each component. (B) The MOT component activations on post-correct trials (divided by response laterality) and post-error trials as a function for each group. Only errors of commission are considered. (C) Post-error motor adaption for MOT components as a function of group. We calculated PEMA as the difference in activation between post-error trials and post-correct trials on the relevant side. Group differences in PEMA are indicated with t statistics and p values (1-tailed). (D) Scatterplot showing the association between VAN error amplitude and PEMA, averaged over right and left MOT networks. The simple regression model was determined with backward selection (see Methods section). Grey contours indicate the 95% confidence interval for the regression line (dashed black line).

