Figure 5.
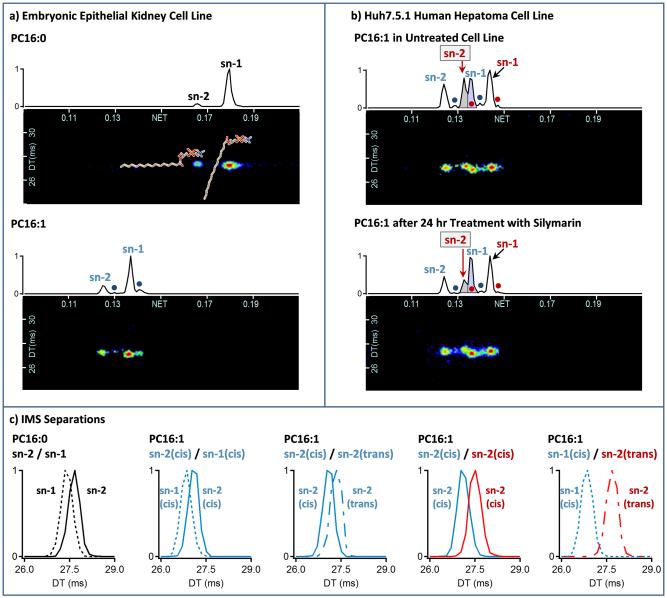
XICs are shown for a) PC16:0 and PC16:1 in a human embryonic epithelial kidney cell line and b) PC16:1 in a Huh7.5.1 hepatoma cell line. c) IMS separations are also extracted from a) and b) for different 16:0 and 16:1 isomer pairs to better illustrate their differences. In most mammalian systems studied, PC16:0 has 2 peaks corresponding to the sn-1 and sn-2 attachment of the acyl chain, and PC16:1 has 4 peaks with the two main isomers occurring when the double bond is in the center of the lipid with a cis-orientation and the acyl chain is at either the sn-1 or sn-2 position (denoted as sn-1 and sn-2) as shown in a). The other two minor peaks represent the trans-orientation of each form (denoted with dots) and elute directly after their cis counterparts. The Huh7.5.1 human hepatoma cell lines behaved differently than most systems studied with 8 peaks observed for lysoPC16:1 as shown in b). The peaks labeled in blue are the same as those observed in the kidney cell line (from the bottom a) panel), but the peaks in red represent a new double bond position closer to the lipid head group. Upon treatment with silymarin, the boxed red sn-2 peak (highlighted in gray) dramatically decreases while most other peaks did not change. IMS was also able to resolve 2 of the isomers that co-eluted in the LC dimension (purple peak in b) panel) and their IMS separation is shown on the far right side of the c) panel).

