
Figure 5.
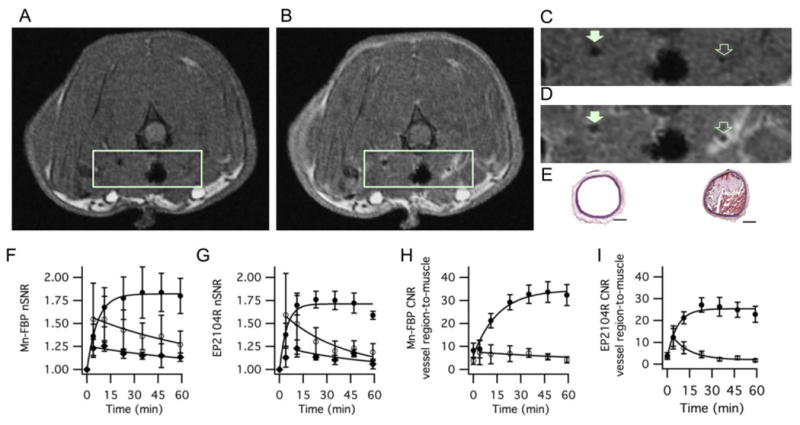
Molecular MR imaging of carotid artery thrombus in a rat model with Mn-FBP. Axial T1-weighted images before (A, C) and 35 minutes after intravenous administration of Mn-FBP (B, D) at 1.5T. (C) and (D) are expanded regions from (A) and (B), respectively showing the common carotid arteries. Mn-FBP generates marked signal enhancement in the ipsilateral vessel (open arrow, D) after Mn-FBP injection, but not in contralateral vessel (filled arrow, D) or in the vessel prior to Mn-FBP injection (C). (E) Hematoxylin and Eosin stained sections of contralateral (left) and ipsilateral (right) carotid arteries showing occlusive thrombus in the injured vessel; scale bar = 300 μm. (F) and (G) show normalized signal-to-noise ratio (nSNR) of the thrombus (closed circles), contralateral vessel region (open circles), and muscle (closed diamonds) following administration of Mn-FBP and EP2104R, respectively, showing persistently enhanced thrombus with each probe and washout of signal from background tissue. (H) and (I) contrast-to-noise ratio (CNR) of thrombus-to-muscle (closed circles) and contralateral vessel region-to-muscle (open circles) following administration of Mn-FBP and EP2104R, respectively, showing large and persistently high CNR for the thrombus with each probe . N=4 for each probe, error bars represent standard error of the mean.