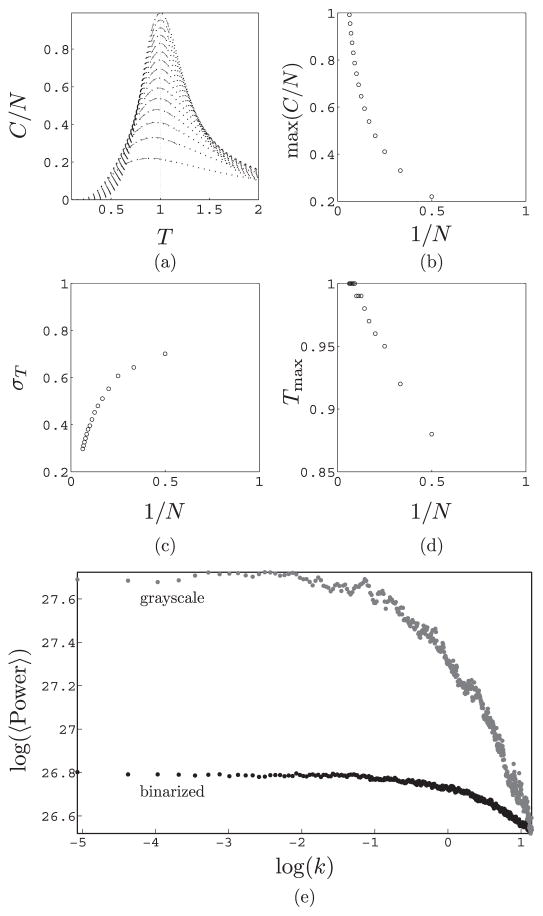
Figure 3.
Studying 1D samples from the ensemble Θ for systems of linear size N = {2, 3, …, 16}. (a) C/N is plotted versus T. The dashed curves are the gaussian fit around the peak. (b) Finite size scaling. The peak of C/N is plotted versus 1/N. (c) Here the width σT (obtained from the gaussian fit near the peak) is plotted versus 1/N. (d) The location of the peak is plotted versus 1/N. Unlike the curves in panels b and c, it saturates in the large N limit. (e) The power spectrum of 1D stripes with 1000 pixels before (in gray) and after binarization (in black) are given. The data points for binarized samples are shifted up by 14.7.

