
Fig. 2.
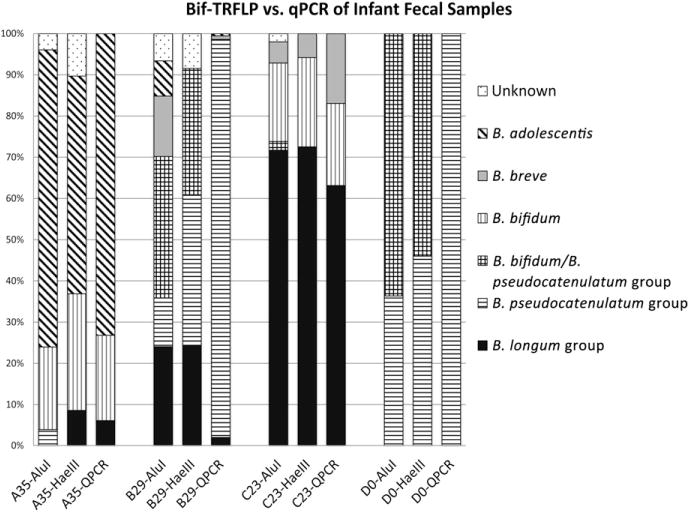
Comparison of Bif-TRFLP to bifidobacterial species-specific qPCR. The percentage of the total bifidobacterial content contributed by each species is shown for four infant fecal samples (A35, B29, C23, D0). The results of both restriction cuts of the Bif-TRFLP are shown, as well as the combined data for all species measured by qPCR. The letter in the bar label indicates the specific infant, while the number indicates the week of life when the sample was collected.