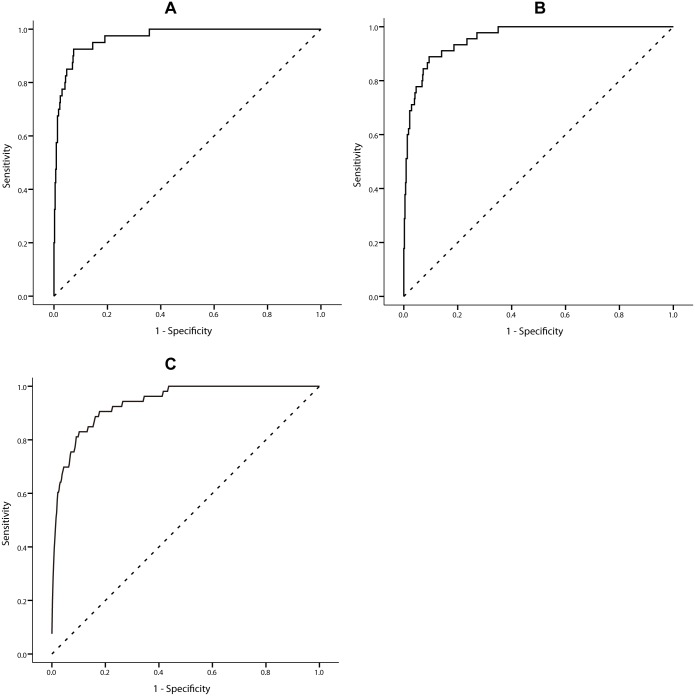
Fig 5. ROC curves for forecasting dengue epidemics in Zhongshan at a threshold of (A) 3 cases in a week, (B) 2 cases in a week and (C) 1 case in a week.
To validate the robustness of our model and avoid overfitting, a k-fold cross-validation with a k value of 10 was applied. ROC curves were plotted again for each model in this section (S1 File), with average 0.938, 0.956 and 0.967 AUC at a forecasting threshold of 1, 2 and 3 cases per week, respectively. In the out-of-sample prediction (detailed results in S1 File), the sensitivity of our model remained as high as 78.83% and specificity 92.48% when we intend to forecast outbreaks involving more than 3 cases in a week in Zhongshan. Similarly, when we intend to forecast outbreaks with a smaller threshold, i.e., 1 case per week, our model had a sensitivity of 85.16% and specificity of 87.25% and at 2 cases per week, the sensitivity was 91.17% and specificity 84.00%. Such results meant that our model was rather robust and accurate.

