. 2015 Nov 27;4:e09600. doi: 10.7554/eLife.09600

Figure 4. fMRI BOLD signal as a function of neural response.

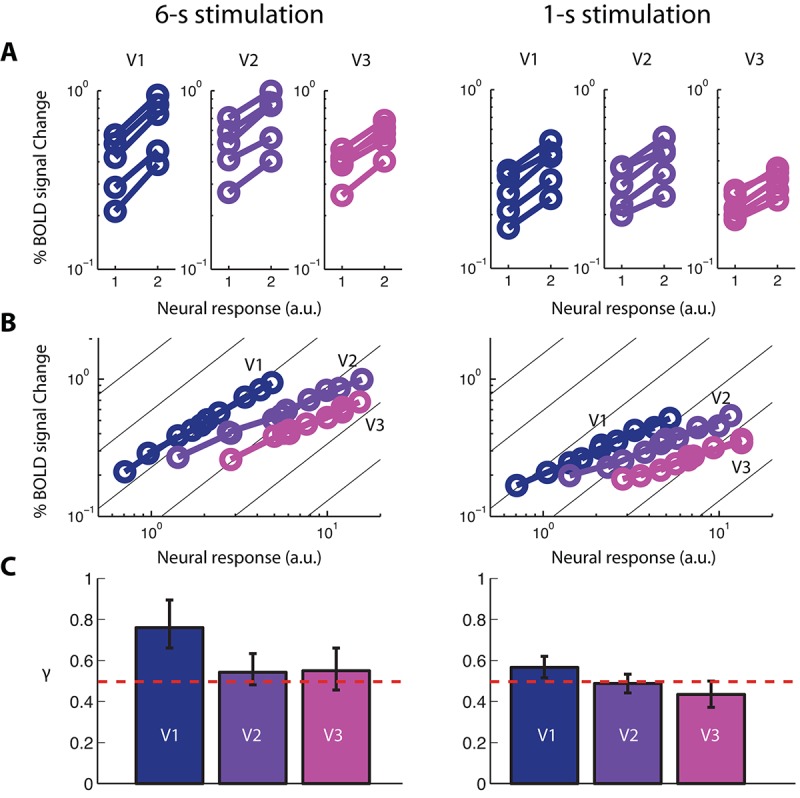
(A) Five pairs of BOLD response amplitudes evoked in V1-V3 with the single- and double-sided stimulations, each with two stimulus durations, 6-s (left column) and 1-s (right column). If the neural response to a single-sided stimulus is Zi, then the neural response to the corresponding double-sided stimulus will be 2Zi, given our empirical determinations of co-localization and independence of the neuronal populations in an achiasmic visual cortex. (B) The BOLD vs. neural response (BvZ) functions for V1-V3 as inferred by the stitching procedure for the two stimulus durations. The inferred functions can be well fitted with power-law functions (i.e. straight lines in log-log coordinates). These functions are nonlinear, with a log-log slope significantly shallower than unity (the background gray lines). (C) The exponents (γ) of the power-law fit of the BvZ functions for V1-V3. Error bars denote 95% CI. The red line indicates γ = 0.5. γ estimated from V2 and V3 (γ ~ 0.5) were not significantly different, while that obtained from V1 was biased upward, due to a violation of the co-localization assumption (see Discussion) required for inferring the BvZ function using the summation experiment. We thus inferred the (true) BvZ function of V1-V3 using the average γ estimated from V2 and V3 only.
DOI: http://dx.doi.org/10.7554/eLife.09600.011

Figure 4.

Figure 4—figure supplement 1. Alternative derivation of the BvZ function.

Figure 4—figure supplement 1.

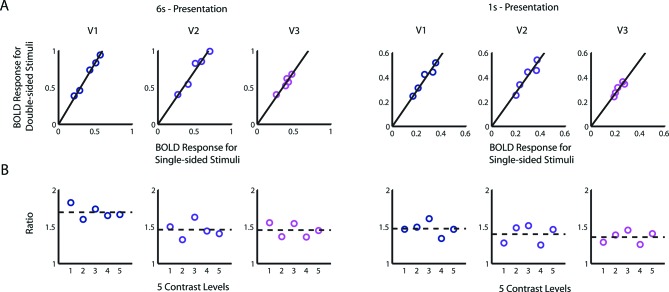
(A) BOLD amplitudes evoked with a double-sided stimulus were linearly proportional to that evoked with the corresponding single-sided stimulus of the same contrast. There were 5 runs per data point for the 6-s condition and 9 runs for the 1-s condition. For each of the visual areas V1-V3, a linear function provides a good fit the data points [6 s: R2≥0.90; 1 s: R2≥0.85], and the intercepts are not significantly different from zero [nested model comparison for each visual area; 6 s: F(1,3)<0.37, p>0.59; 1 s: F(1,3)<0.27, p>0.64]. (B) Equivalently, contrast had no significant effect on the ratio of BOLD amplitude of a double-sided condition to that of the corresponding single-sided condition [nested model comparison for each visual area, 6 s: F(1,3)<0.53, p>0.52; 1 s: F(1,3)<0.16, p>0.72]. Performing a one-way ANOVA on the BOLD ratios obtained from individual runs also failed to find any significant effect of contrast in any of the visual areas [6 s: F(4,20)<0.37, p>0.8; 1 s: F(4,40)<1.76 p>0.15]. Assuming that the underlying neural responses to the double-sided stimuli is twice those of the corresponding single-sided stimuli, these results imply that the relationship between neural and fMRI BOLD responses follows power law: B = kZγ, where γ can be determined from the ratio of BOLD amplitude evoked by the double-sided stimuli to that evoked by the single-sided ones: γ = log2(B2,i/B1,i). The estimated values of γ from the BOLD ratios are 0.75 (V1), 0.54 (V2), 0.53 (V3) from the 6 s presentation and 0.55 (V1), 0.48 (V2), 0.44 (V3) from the 1 s presentation. These values are very close to those estimated using the stitching procedure (Figure 4C).
Figure 4—figure supplement 2. Robustness of BOLD summation results.

Figure 4—figure supplement 2.

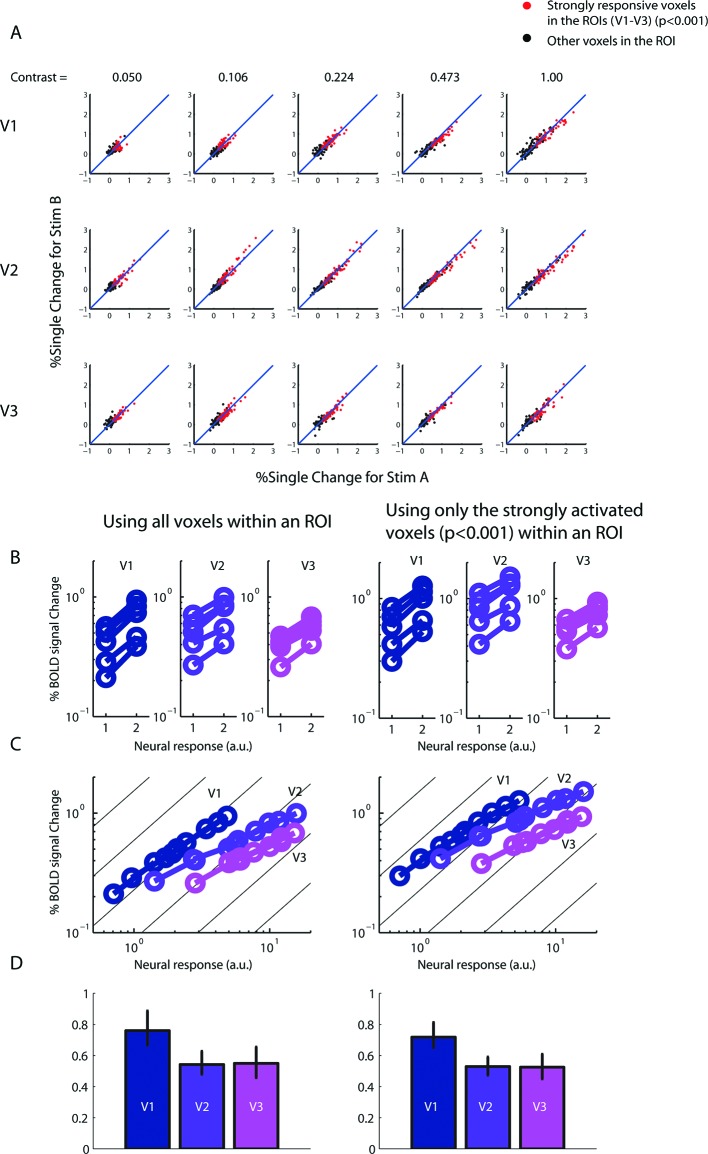
(A) BOLD amplitudes of every voxel in each ROI (V1-V3) as evolved by the two versions of the single-sided stimulus (Stim A and B of Figure 3) in the 6-s experiment. The voxels responded approximately equally to both versions of the stimulus, indicating that any imperfect homotopy and/or gaze control did not significantly affect the stimuli's ability to equally co-activate the voxels. Red dots represent voxels in the ROIs that were strongly responsive (uncorrected p<0.001) to both versions of the stimulus. Reanalyzing the data using only these strongly responsive voxels yielded essentially the same results as in Figure 4 when all the voxels with the ROIs were used (right vs. left column, respectively, of B–D.