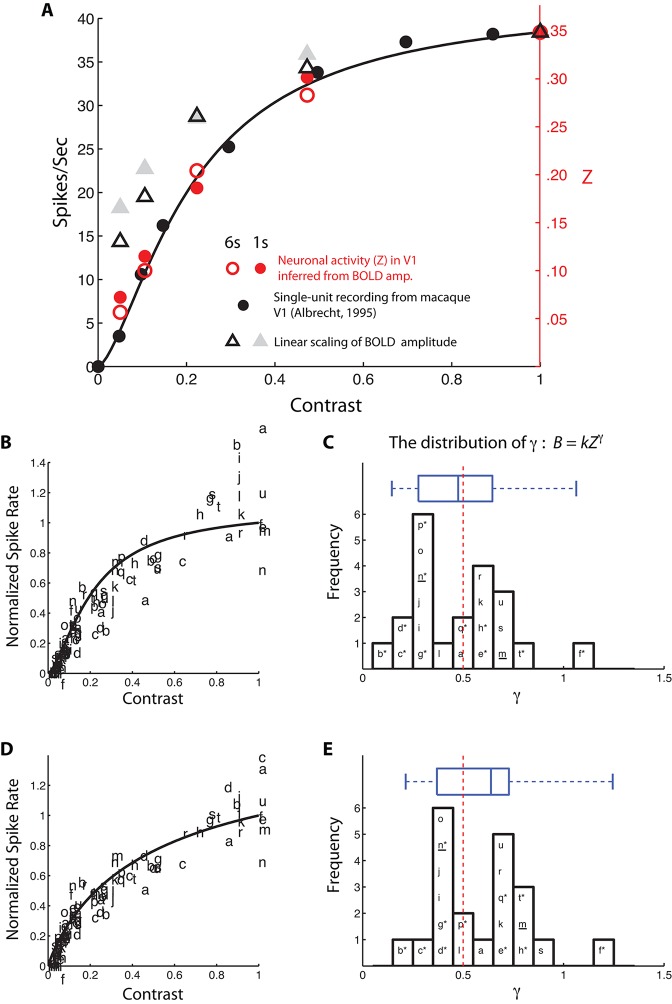
Figure 5. Comparisons between neural response inferred from the BvZ function (B = kZγ) and single-unit spiking activity.
(A) Neural contrast response functions. The black dots and line are the average single-unit firing rate as a function of luminance contrast recorded in macaque V1 (replotted from Albrecht, 1995) and the best fitting Naka-Rushton function (Naka and Rushton, 1966), respectively. Red open and filled circles represent the BvZ-inferred neural contrast responses in V1 of the achiasmic subject, computed from our 6-s and 1-s single-sided BOLD data sets (from Figure 3 and Figure 3—figure supplement 1) and matched to single-unit firing rates with a single scaling constant to align the data point at contrast = 1. Gray open and filled triangles represent the linearly scaled BOLD contrast responses from the same data sets. The BvZ-inferred neural responses are in excellent agreement with the single-unit spiking data, whereas linearly scaled BOLD responses are not. (B) fMRI BOLD contrast responses from 21 published data sets (a-u; see Table 1) were individually matched to the single-unit spiking responses function of (A), assuming a power-law function to convert BOLD response to spike rate. The fits were good, with R2 ranging from 0.73 to 0.99. The distribution of the best-fitting exponents (γ) is shown in (C). The median of the distribution (0.48) is close to the exponent (0.5, red dashed vertical line) of the BvZ function inferred from the achiasmic subject. Asterisk (*) marks studies in which subjects attended to the stimuli used to obtain the contrast response functions. Underline (_) marks studies that measured and analytically discounted any task-related baseline response from the contrast response functions. (D,E) An otherwise identical analysis as in (B,C) but using the single-unit (spike rate) contrast response function obtained from Heeger et al. (2000) instead of the single-unit contrast responses function used in (A) from Abrecht (1995). (Note that some data points are out of the ordinate range in B and D; they are omitted from the plots.)

