Figure 3. NG2+ glia, but not pericytes, control blood vessels formation.
(A–C) Double immunohistochemistry for the YFP and Isolectin (A1–A2) or PDGFRβ (B1–B2, C1–C2) on coronal cingulate cortex (CCi) and cingulate bundle (CI) sections of Nkx2.1-cre+/Rosa-EYFP (A1, C1–C2) and Cspg4-cre+/Rosa-EYFP (A2, B1–B2) mice (n=3) at E16.5 (A1–A2) and E18.5 (B1–B2 and C1–C2). (A–C) From E16.5 to E18.5, numerous YFP+ NG2 glia are surrounding cortical blood vessels. (B–C) The Cre-mediated recombination, visualized by the YFP signal, can be observed in only very few pericytes surrounding blood vessels in Cspg4-cre+/Rosa-EYFP mice (B2, boxed region showing high magnification of region marked with white arrowhead), but not in Nkx2.1-cre+/Rosa-EYFP mice (C2, boxed region showing high magnification of region marked with arrow). (D–F) Double immunohistochemistry for NG2 and PDGFRβ on coronal CI sections in wild-type (D1–D2), Nkx2.1-cre+/Rosa-DTA (E1–E2) (n=3) and Cspg4-cre+/Rosa-DTA (F1–F2) (n=3) mice at E18.5. (D–F) The NG2+ glia form a complex cellular network around the cortico-cerebral blood vessels outlined by NG2 and PDGFRβ staining. The DTA under the control of Nkx2.1 (E) and Cspg or NG2 (F) promoters selectively depletes NG2+ glia but not pericytes. D2, E2, and F2 are higher power views of the cingulate region in D1, E1, and F1, respectively (white arrowheads). (G) Bars (means ± SEM) represent the percentage of YFP-negative and YFP-positive PDGFRβ labeled pericytes in dorsal telencephalon sections of E18.5 Cspg4-cre+/Rosa-EYFP mice (n=10). The YFP signal in Cspg4-cre+/Rosa-EYFP mice was not detected in PDGFRβ+ embryonic pericytes of the dorsal telencephalon (95.05 ± 1.54% of pericytes are YFP-negative in the CI at E18.5, n=10). (H) Bars (means ± SEM; unpaired Student’s t-test) represent the percentage of remaining PDGFRβ+ pericytes in cingulate bundle (Cl) sections of E18.5 Cspg4-cre+/Rosa-DTA mice (n=11) compared to control mice (n=11). No loss of PDGFRβ+ pericytes was observed in Cspg4-cre+/Rosa-DTA mice compared to Cspg4-cre-/Rosa-DTA. Bar = 100 μm in B1, C1; 50 μm in A1, A2, D1, E1, F1; 40 μmin B2, C2, D2, E2, F2.

Figure 3—figure supplement 1. Drastic depletion of GAD67-GFP+ neurons in Nkx2.1-/-, Nkx2.1-cre+/Rosa-DTA and Nkx2.1-cre+/Eno2-DTA cortices.

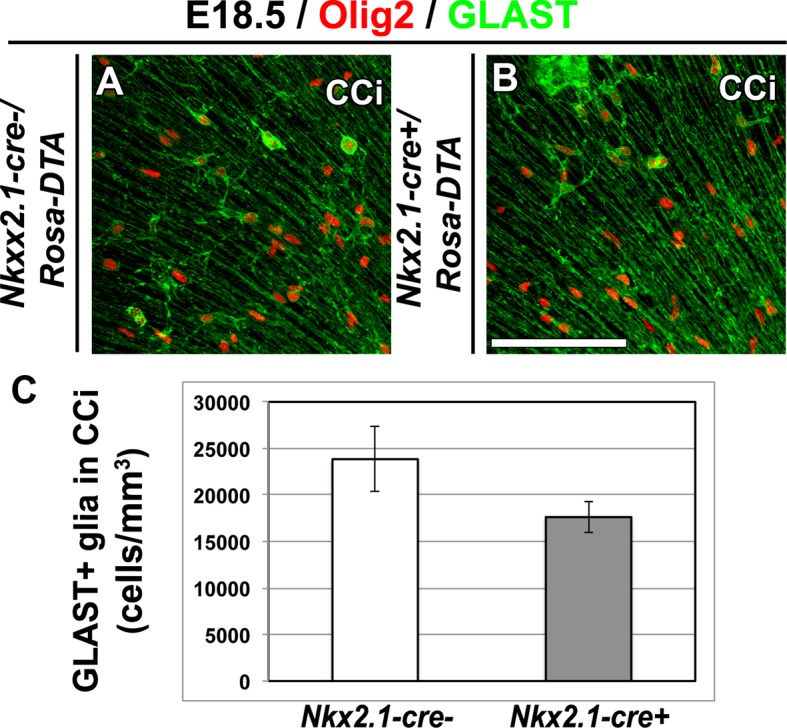
Figure 3—figure supplement 2. GLAST+ astrocytes are not affected in Nkx2.1-cre+/Rosa-DTA cingulate cortex at E18.5.