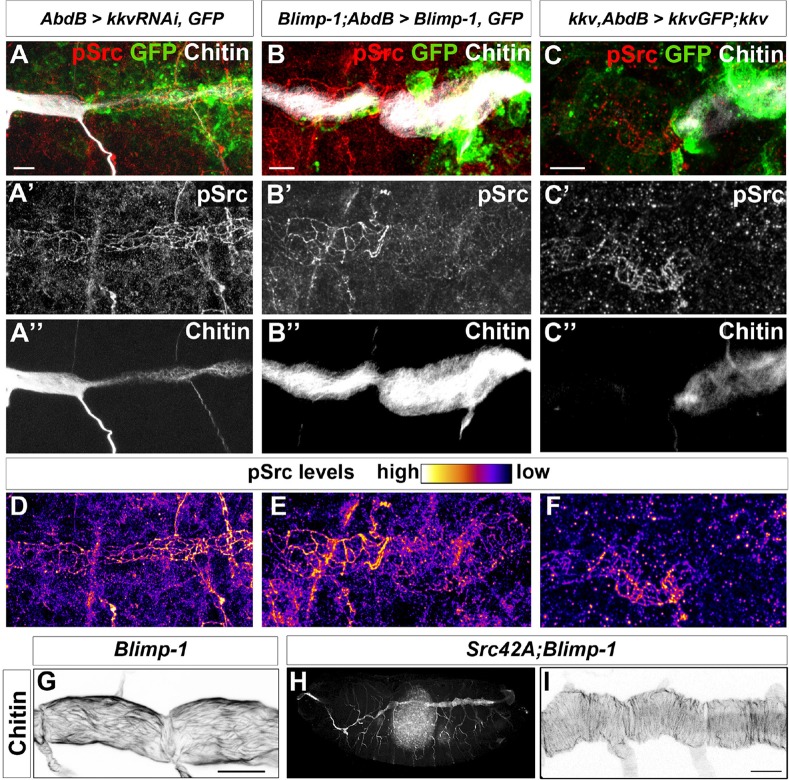
Figure 10. Chitin levels modulate Src activation.
(A and D) Wild-type embryo expressing AbdBGAL4UASkkvRNAi and UASSrcGFP, stained with anti-GFP (green, A) to visualise the AbdB domain, anti-pSrc (red, A’) to detect activated Src42A, and fluostain (grey, A’’) to label chitin. Levels of pSrc are better visualised in D, with a different colour-coded LUT. (B and E) Blimp-1 mutant embryo, expressing AbdBGAL4UASBlimp-1 and UASSrcGFP, to rescue the Blimp-1 phenotype at the posterior end of the embryo, stained with anti-GFP (green, B) to visualise the AbdB domain, anti-pSrc (red, B’) to detect activated Src42A, and fluostain (grey, B’’) to label chitin. Levels of pSrc are better appreciated in E, with a different colour-coded LUT. (C and F) kkv mutant embryo, expressing AbdB-GAL4 and UASkkvGFP, to rescue the kkv phenotype at the posterior end of the embryo, stained with anti-GFP (green, C) to visualise the AbdB domain, anti-pSrc (red, C’) to detect activated Src42A and fluostain (grey, C’’) to label chitin. Levels of pSrc are better appreciated in F, with a different colour-coded LUT. Scale bars 10 µm. (G-I) Late stage 16 embryos stained with fluostain to visualise taenidial organisation. (G) Detail of Blimp-1 dorsal trunk showing taenidial disorganisation; (H) whole Src42A;Blimp-1 double mutant, showing some of the characteristic Blimp-1 tracheal phenotypes; (I) Detail of Src42A;Blimp-1 double mutant dorsal trunk showing rescued taenidial organisation. Scale bars 25 µm.


