. 2016 Feb 2;5:e09373. doi: 10.7554/eLife.09373

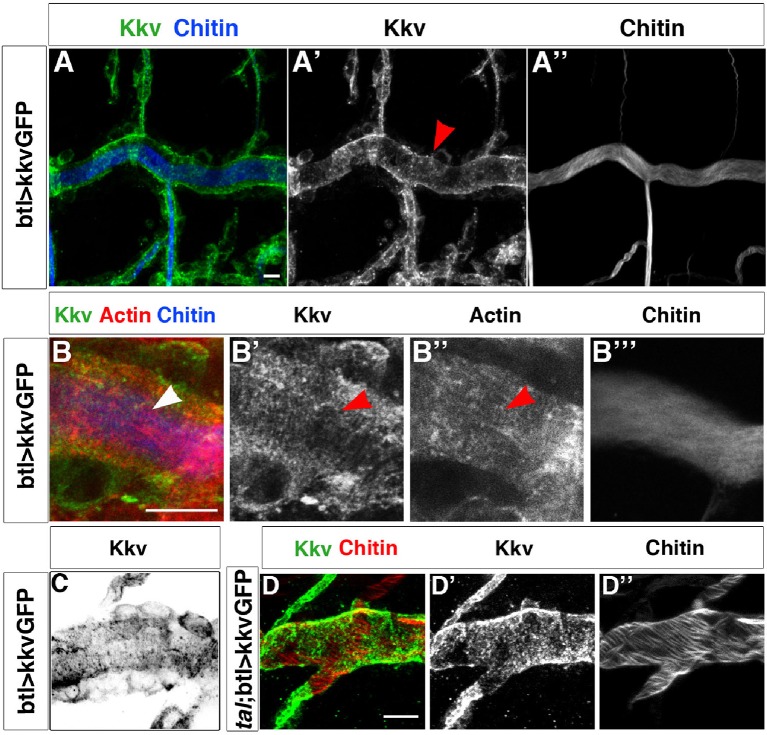
Figure 3. Kkv co-localises with F-actin rings during tracheal maturation.

(A) Detail of stage 16 wild-type embryos expressing a kkvGFP transgene in tracheal cells and stained with fluostain to reveal the chitin filament; Kkv is detected in rings that resemble the F-actin rings (arrowhead in A’). (B) DT zoomed detail of stage 16 wild-type embryos expressing a kkvGFP transgene in tracheal cells and stained with fluostain and phalloidin to reveal the chitin filament and the F-actin rings (arrowheads). (C) Detail of a stage 17 embryo expressing kkvGFP in tracheal cells, showing the localisation of Kkv in rings throughout the length of the tube. (D) Detail of stage 17 tal/pri embryos expressing a kkvGFP transgene and stained with fluostain to reveal the chitin aECM; in tal/pri mutants, Kkv is detected in a punctate pattern throughout stages 16–17 and not in lines or bundles, in contrast to wild-type embryos. In all panels anterior is to the left and scale bars = 10 μm.

DOI: http://dx.doi.org/10.7554/eLife.09373.006

Figure 3.

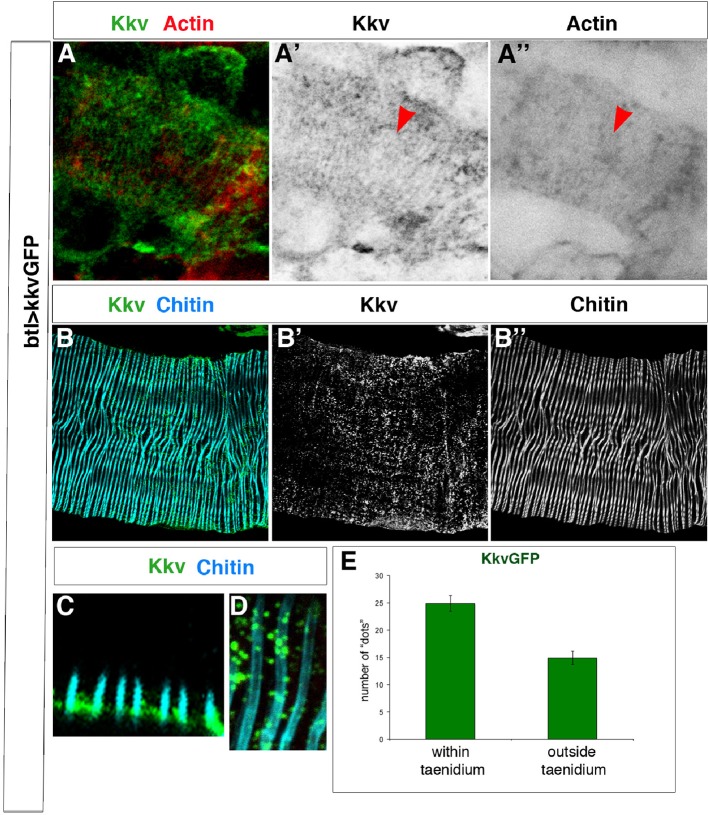
Figure 3—figure supplement 1. Kkv co-localises with F-actin and chitin rings at embryonic and larval stages.

Figure 3—figure supplement 1.

(A) Detail of stage 16 wild-type embryos expressing a kkvGFP transgene in tracheal cells and stained with phalloidin to reveal the F-actin rings; Kkv is detected in rings that resemble the F-actin rings (arrowhead in A’). (B) DT zoomed detail of an L3 larva expressing a kkvGFP transgene in tracheal cells and stained with anti-GFP antibody to detect KkvGFP localisation and fluostain to reveal the chitin filament. (C) Zoomed detail of the apical membrane of the tracheal cells of an L3 larva expressing a KkvGFP showing how the larger KkvGFP units overlap with the taenidia. (D) Zoomed detail of the DT of an L3 larva expressing a KkvGFP showing how the larger KkvGFP units overlap with the taenidia. (E) Quantification of the number of KkvGFP dots that overlap within the taenidium (mean of 24.8 ± 1.4, n = 24) in comparison to the dots localised outside the taenidium (mean of 14.8 ± 1.2, n = 24). Error bars represent ± SEM and p-value is 3.1E-6 by two-tailed unpaired Student’s t-test.