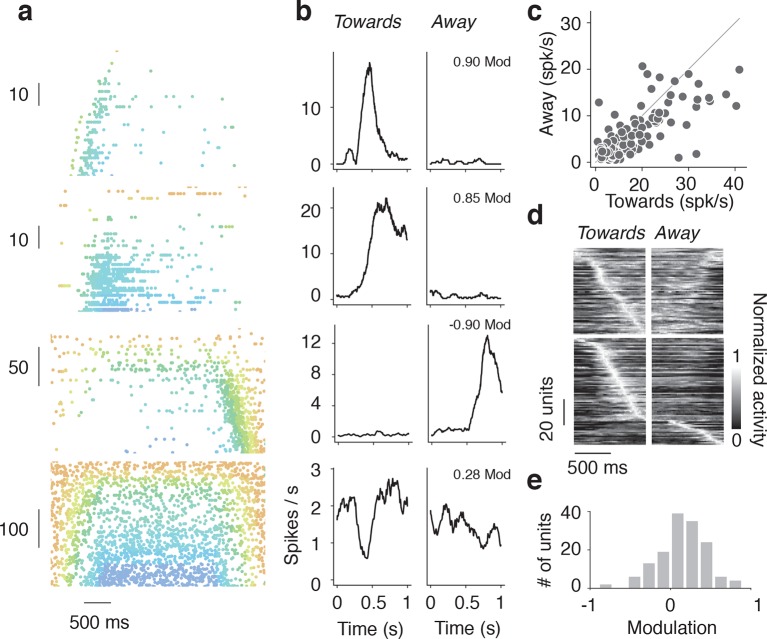
Figure 5. Tuning to direction of wall movement.
(a) Example spike rasters of regular spiking units that showed strong modulation by wall direction during open-loop trials during locomotion (running speed over 3 cm/s). (b) Spike rate as a function of time during epochs when wall is moving towards/away from the mice for the same regular spiking units as in a. (c) Heatmap of time profiles curves normalized by maximum for symmetric and asymmetric units, sorted by time to peak. (d) Scatter of the range of spike rates as the wall moved towards and away from the mouse. The range of spike rates is the difference between the maximum and minimum rate during the 1 s when the wall was moving towards or away from the mouse. (e) Histogram of direction modulation index, which is the range difference in spike rates during wall movement towards and away from the mouse divided by the sum of the towards range and away range. Units that respond only when the wall approaches have modulation 1, units that respond only when the wall moves away have modulation −1, and units that respond to both the wall approaching and moving away have a modulation near 0.

