. 2016 Jan 15;5:e10806. doi: 10.7554/eLife.10806

Figure 2. Effect of motion direction on numerosity perception.

(a) There was a significant repulsive aftereffect of motion direction (left, right) on perceived numerosity (mean difference in PSE 7.12 dots, t(10)=2.555, p=0.029, dHedges=0.953; see inset) when adapting with large numerosities (400 dots) in Experiment 1. The scatter plot pits the PSE after rightward motion against the PSE after leftward motion per subject. It shows that adaptation to rightward motion led subjects to perceive the test cloud as less numerous than adaptation to leftward motion, as evidenced by the large fraction of dots above the equality line, which is indicative of a repulsive aftereffect. This was not due to a classical motion aftereffect (Figure 2—figure supplement 1 and Figure 2—figure supplement 2). (b) Psychometric functions of subject aba17. After adaptation to 400 rightward moving dots in Experiment 1, this subject perceived 70 dots in the test dot cloud to be equivalent to 30 dots in the probe dot cloud, thus underestimating the number of dots in the test. After adaptation to leftwards motion, aba17’s PSE was 20 dots lower than after adaptation to rightwards motion, although the number of dots in the two clouds were identical in both conditions. Note that all psychometric functions are shifted away from 30 dots, the probe size, because of a static numerosity adaptation effect that causes subjects to underestimate consecutively presented dot clouds (Burr and Ross, 2008). See Figure 2—figure supplement 3 for additional example subjects. (c) There was also a repulsive motion direction-numerosity cross-adaptation effect after adaptation to small numerosities (30 dots) in Experiment 2. When adapting with numerosities smaller than the probe (166 dots), subjects overestimate the number of dots in the test cloud (Burr and Ross, 2008). Leftward motion-numerosity cross-adaptation should exaggerate this overestimation effect relative to rightward motion. Indeed, the scatter plot shows that PSEs after leftward motion were consistently smaller than for rightward motion (mean difference 15.85 dots; t(9)=4.523, p=0.001, dHedges=1.017, two-sided). This indicates that, as when adapting with large numerosities, leftward motion shifts numerosity perception down the number line, while rightwards motion shifts numerosity perception up the number line. (d) Motion direction affected numerosity perception also directly, in the absence of adaptation. In Experiment 3, subjects compared the numerosities of coherently and incoherently moving dot clouds without prior adaptation. The scatter plot pits the PSE for rightwards motion against the PSE for leftwards motion per subject, and shows that, indeed, all but one subject perceived clouds of rightward moving dots as more numerous than randomly moving clouds (0% coherence) and clouds of leftward moving dots as less numerous than randomly moving clouds (0% coherence). Accordingly, the PSEs for rightwards vs. leftwards conditions were significantly different (mean difference right vs. left −2.08, t(9)=−2.47, p=0.035, dHedges=−0.707, two-sided). Thus, motion direction affects numerosity estimates also without a preceding adaptation phase. Note that since there is no adaptation, there is also no repulsive aftereffect and hence, the direct effect is of the opposite sign than the repulsive aftereffects in a and c. Data in insets are represented as mean ± SEM. All data shown here are publicly available at Figshare (Schwiedrzik et al., 2015).

DOI: http://dx.doi.org/10.7554/eLife.10806.005

Figure 2.

Figure 2—figure supplement 1. Adaptation paradigm to test classical motion aftereffects.

Figure 2—figure supplement 1.

The design and all stimulus parameters of this control experiment were the same as for Experiment 1, but subjects now had to report the direction of motion instead of the numerosity of the dot clouds. Each block started with a 30 s adaptor, consisting of two clouds of 400 dots each (50% black, 50% white). Dots in the top cloud moved to the left or to the right at 100% coherence (as indicated here by arrows; panels i-iii), or randomly (panel iv). Dots in the bottom adaptor cloud always moved randomly (0% coherence). To maximize directional adaptation at the top location, each condition was tested in a separate block. Each trial started with a 5 s top-up adaptor. After a 400 ms inter-stimulus interval (ISI), we presented a test stimulus at the top location, with 60 dots moving in random directions. After another 400 ms ISI, we presented the probe stimulus, consisting of 30 dots moving at 100% coherence either in the same (panel i) or in the opposite direction (panel ii) of the adaptor. Subjects then had to press the ‘up’ button on the keyboard when they perceived that the motion direction was the same in the test and the probe cloud, or the ‘down’ button when they perceived the test and the probe cloud to move in different directions. This allowed us to test whether subjects perceived attractive or repulsive motion aftereffects: For example, if subjects consistently perceived an attractive motion aftereffect, we expected them to respond ‘same’ after leftwards adaption when the lower cloud was moving to the left (panel i). In contrast, if they perceived a repulsive motion aftereffect, we expected them to respond ‘same’ after leftwards adaption when the lower cloud was moving to the right (panel ii). To assure that subjects were following task instructions, we also presented coherent motion to the left or right in the upper cloud on 1/3 of the trials within a block, followed by motion in the same or opposite direction in the lower cloud (panel iii). Here, we expected subjects to respond ‘same’ whenever the two clouds were actually moving in the same direction. To control for response biases, we also adapted subjects to incoherent dot clouds above and below the fixation cross in a separate block to control for an overall propensity to respond ‘same’ or ‘different’ (panel iv).

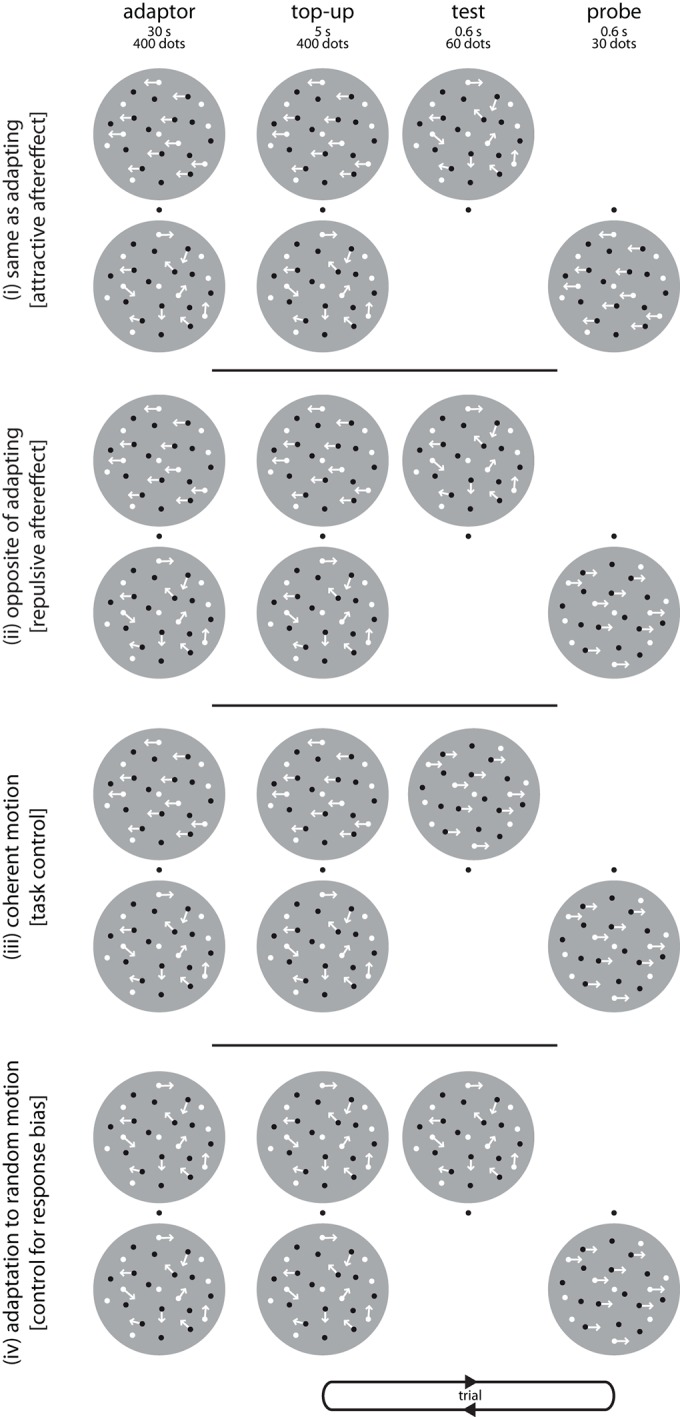
Figure 2—figure supplement 2. Control for classical motion aftereffects.

Figure 2—figure supplement 2.

Gray bars represent the mean (± SEM), red circles represent the median percent ‘same’ responses as a function of condition. Subjects did not perceive attractive or repulsive classical MAEs when incoherently moving dots were presented at the test location (perceived direction), while performance on trials which contained coherent motion in both clouds was at ceiling (actual direction). Neither the mean nor the median percent ‘same’ responses were significantly different from 0 in the aftereffect conditions (mean: one sample t-tests, two-sided, all p>0.05; median: percentile bootstrap, all p>0.37), and the percentage of ‘same’ responses did not differ between attractive and repulsive aftereffect conditions (mean: t(10)=−1.7417, p=0.11, two-sided; median: percentile bootstrap, p>0.38). In line with these results, none of the subjects reported perceiving directional motion in the randomly moving test clouds during debriefing after the experiments. This indicates that the effect of motion direction on numerosity perception arises in the absence of a classical MAE (like other high-level MAEs, Whitney and Cavanagh, 2003), and thus likely in a different brain area. Hence, the control experiment implies that motion direction acts directly on numerosity perception, in line with an account where the same neurons code for motion direction and numerosity. All data shown here are publicly available at Figshare (Schwiedrzik et al., 2015).

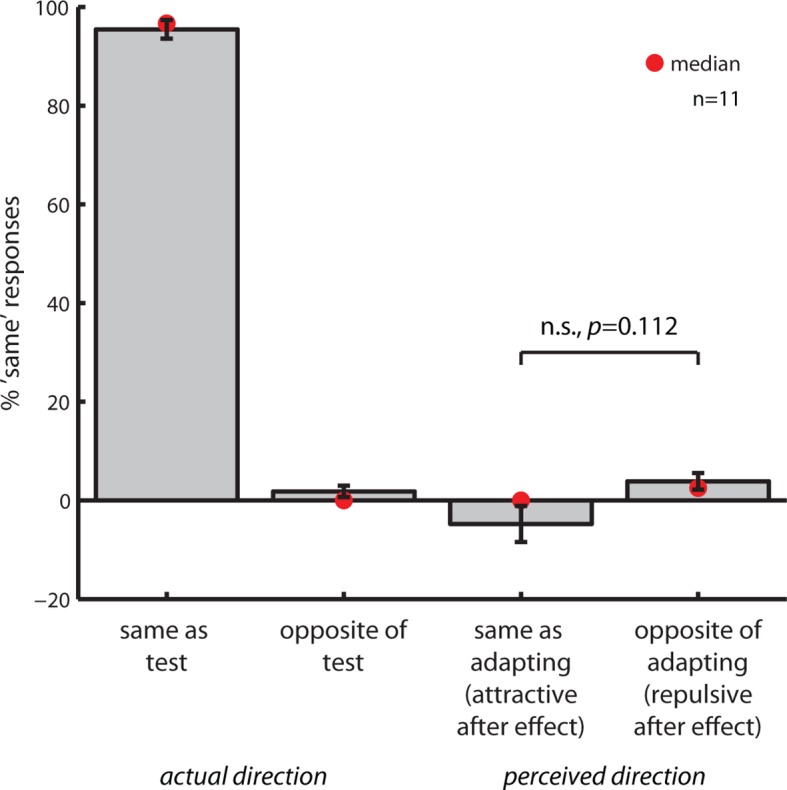
Figure 2—figure supplement 3. Additional example subjects from Experiment 1.

Figure 2—figure supplement 3.

(a) Psychometric functions of subject cpb26. After adaptation to 400 rightward moving dots in Experiment 1, this subject perceived 56 dots in the test dot cloud to be equivalent to 30 dots in the probe dot cloud, thus underestimating the number of dots in the test. After adaptation to leftwards motion, cpb26’s PSE was 21 dots lower than after adaptation to rightwards motion, although number of dots in the two clouds were identical in both conditions. (b) Psychometric functions of subject tlq25. After adaptation to 400 rightward moving dots in Experiment 1, this subject perceived 61 dots in the test dot cloud to be equivalent to 30 dots in the probe dot cloud, thus underestimating the number of dots in the test. After adaptation to leftwards motion, tlq25’s PSE was 7 dots lower than after adaptation to rightwards motion, exhibiting overestimation relative to rightward motion adaptation. All data shown here are publicly available at Figshare (Schwiedrzik et al., 2015).