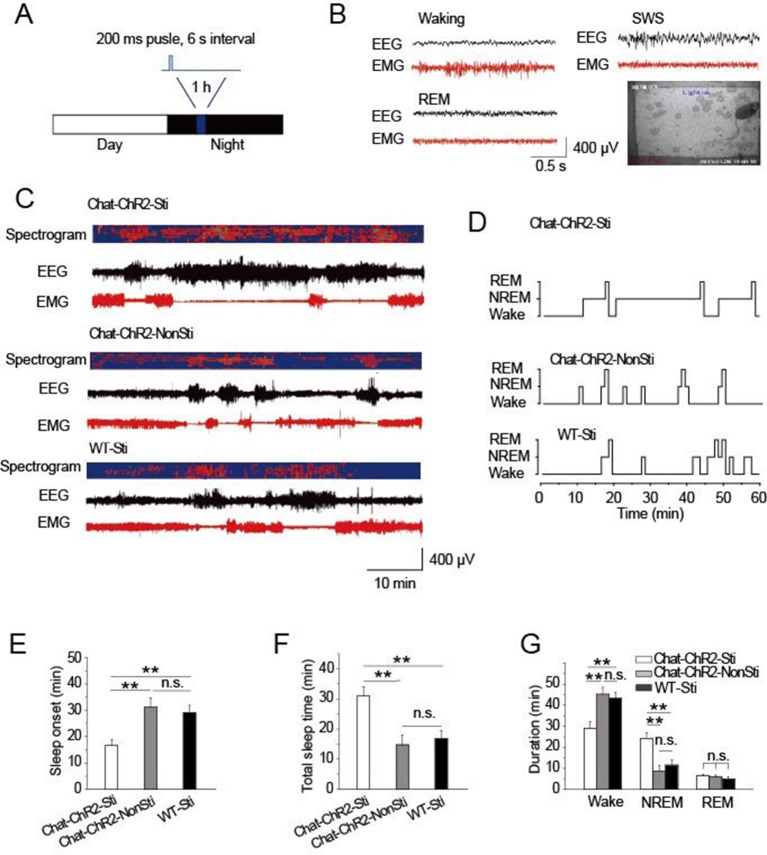
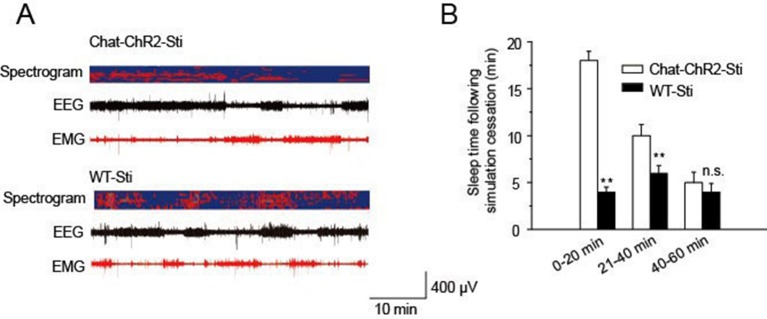
Figure 2. Activation of cholinergic fibers promoted sleep.
(A) Stimulation protocol in the TRN of ChAT-ChR2 mice. A 473 nm laser was used at 1.5 mW to deliver 200-ms pulses at 6 s intervals for 1 hr. (B) EEG, EMG, and video recordings were used to determine sleep-waking patterns and examine sleep architecture; examples of states (Waking, SWS, REM). (C) EEG trace during 1 hr stimulation period. (D) Representative hypnograms for ChAT-ChR2-Sti, ChAT-ChR2-NonSti and WT-Sti mice over 1 hr test period. Optical stimulation given to ChAT-ChR2 and WT-Sti mice consisted of 200-ms pulses. (E) Latency to sleep in ChAT-ChR2-Sti, ChAT-ChR2-NonSti and WT-Sti mice. (F) Total sleep time of ChAT-ChR2-Sti, ChAT-ChR2-NonSti and WT-Sti mice during 1 hr stimulation. (G) Time spent in NREM stage for ChAT-ChR2-Sti, ChAT-ChR2-NonSti and WT-Sti mice. In (E, F, G), all data represent mean ± SEM (n = 8 mice, *p < 0.05, **p < 0.01, two-tailed t-test between ChAT-ChR2-Sti mice and ChAT-ChR2-NonSti or WT-Sti mice). See also Figure 2—figure supplement 1.


