. 2015 Dec 23;4:e12401. doi: 10.7554/eLife.12401

Figure 4. Airineme dependent patterning and airineme targeting specificities.

(A) dnCdc42 blocks airineme extension (χ2=16.4, d.f.=1, p<0.0001, N=43 cells total). (B) Interstripe melanophores persisted when airinemes were blocked with dnCdc42. Cell states are indicated by logos in lower left corners (X, aox5+ xanthophore lineage). Insets, brownish melanophores persisting from embryonic/early larval pattern and gray–black adult melanophores. (C) Airinemes contacting melanophores (arrows; Me, early larval; Mn, new; Mp, previously differentiated; xan, xanthophore). (D) Stabilization times (median ± IQR) of aox5+ airinemes on cells of melanophore (M) or xanthophore (X) lineages for zebrafish, cx41.8 mutant zebrafish, and pearl danio. aox5+ airinemes of wild-type zebrafish were less likely to stabilize, and stabilized more briefly (*, both p<0.0001) after contacting cells of the xanthophore lineage as compared to melanophores; this target specificity was altered in cx41.8 mutant zebrafish as well as pearl danio. Y-axis is split for clarity. (E) Zebrafish aox5+ airinemes were most likely to stabilize on Me and Mn (*, p<0.0001; median ± IQR). (F) cx41.8 mutant airinemes stabilized on aox5+ cells (arrow). (G) Vesicle transfer (arrow) to melanophore. Scale bars: 200 µm (B); 50 µm (C); 50 µm (F); 25 µm (G).

DOI: http://dx.doi.org/10.7554/eLife.12401.018

Figure 4.

Figure 4—figure supplement 1. Pharmacological blockade of airineme production.

Figure 4—figure supplement 1.

(A) Cytoskeletal inhibitors reduced projection formation relative to controls (overall: χ2=24.0, d.f.=3, p<0.0001; among inhibitors: χ2=1.7, d.f.=2, p=0.4, N=212 cells). (B) Treatment with Cdc42 inhibitor ML141 resulted in excess interstripe melanophores (arrow). Fish were treated with epinephrine to partially contract pigment granules toward cell centers. Scale bar: 200 µm (B).
Figure 4—figure supplement 2. Expression of dnCdc42 transgene for inhibition of airinemes.

Figure 4—figure supplement 2.

(A) Trunk cross-section during pigment pattern formation (~7.5 SSL) for individual expressing aox5:Tet:nVenus-2a-dnCdc42 mosaically and stained for Venus immunoreactivity. Nuclear-localizing Venus was co-expressed with xanthophore lineage marker Pax7 (Minchin and Hughes, 2008) (arrow; arrowhead indicates a Pax7+ cell not carrying the transgene). (B) High-resolution micrograph of aox5+ xanthoblast in wild-type zebrafish (7.5 SSL) illustrating airineme with vesicle (arrow) as well as short filopodia that lack vesicles (e.g., arrowhead). (C) Frames from time-lapse imaging (5 min intervals) showing aox5+ cells after several days of dd treatment to express dnCdc42 at low levels. Short filopodia (e.g., arrowheads) and other protrusions (e.g., *) were extended despite inhibition of airineme production. (D) Analyses of protrusive activities in time-lapse videos revealed no significant differences in numbers of short filopodia extended (left: t58=1.07, p=0.3), lengths of lamellipodial protrusions (center: t54=1.20, p=0.2), or speeds of lamellipodial extension (right: t54=0.62, p=0.4). (E) Following extended dd-induction of dnCdc42 (6.5–12.5 SSL), there were not significant differences in the total numbers of xanthophores (t8=0.83, p=0.4) or melanophores (t8=0.27, p=0.8) relative to dd-treated non-transgenic controls. (F) Distributions of aox5+ cells were similar between dd-treated dnCdc42 and control larvae. Scale bars: 20 µm (A); 5 µm (C); 20 µm (C); 50 µm (F).
Figure 4—figure supplement 3. Prolonged airineme contact with motile melanophores.

Figure 4—figure supplement 3.

(A) Example of aox5+ airineme (arrow) contacting tyrp1b+ melanophore (yellow 1), with vesicle (arrowhead) that persisted at least 90 min; a second melanophore is adjacent (red 2) (B) Contacted melanophores were motile: over several days, melanophore 1 traversed melanophore 2 and came to rest in a relatively more dorsal position within the developing stripe. hm, horizontal myoseptum. xan, xanthophore. Scale bars: 20 µm (A); 20 µm (B).
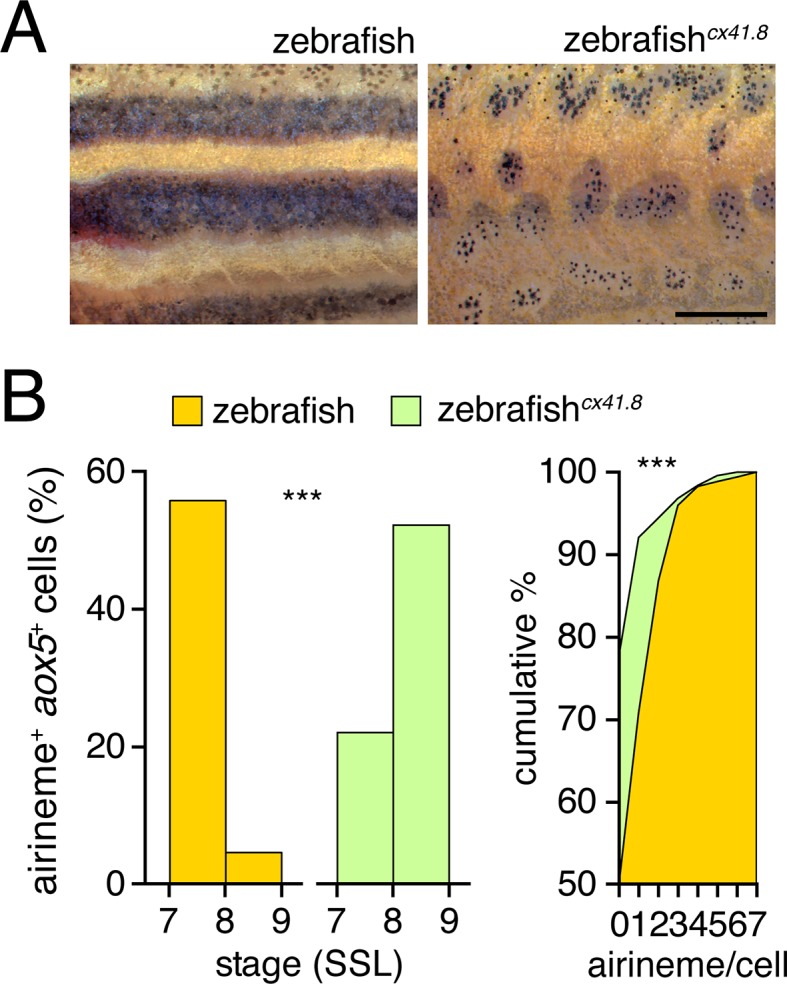
Figure 4—figure supplement 4. Connexin dependence of airineme production.

Figure 4—figure supplement 4.

(A) Phenotypes of wild-type and cx41.8 mutant zebrafish. (B) Stage-specificity of airineme production and numbers of airinemes produced per cell differed between wild-type and cx41.8 mutant zebrafish (left, genotype x stage interaction: χ2=94.2, d.f.=1, p<0.0001, N=639 cells; right, χ2=51.1, d.f.=7, p<0.0001, N=428 cells). Scale bar: 1 mm (A).