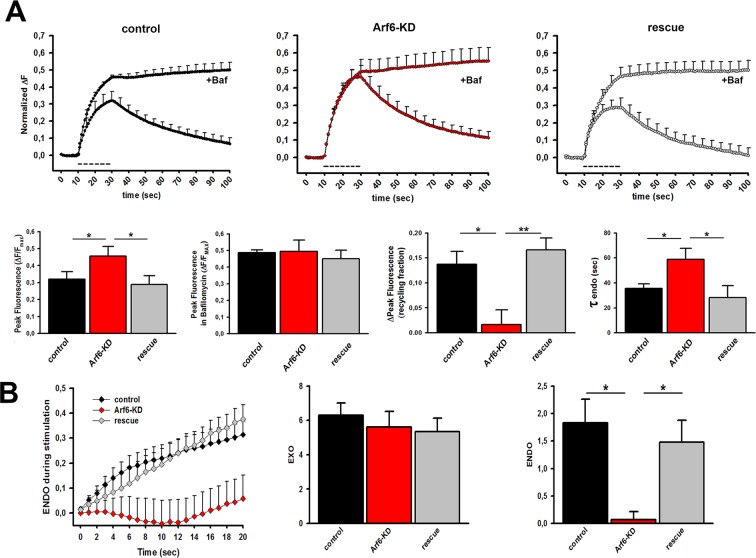
Figure 6. Decreased SV recycling at Arf6-deficient synapses.
(A) Upper panels, ensemble average traces of SypHy fluorescence plotted for control (n=9, left), Arf6-KD (n=8, center) and rescued (n=8, right) neurons stimulated with 400APs@20Hz (dotted line) in the absence or presence of 1 µM Bafilomycin (+ Baf.). Data are means with SEM values shown every 5 time points. Lower panels (from left to right), peak fluorescence at the end of the stimulus in the absence of Baf.; peak fluorescence at the end of the stimulus in the presence of Baf.; ‘during-stimulus’ recycling fraction calculated as the difference between the peak fluorescence in the presence and absence of Baf.; time-constants of ‘post-stimulus’ endocytosis evaluated by fitting the fluorescence decay after stimulation in the absence of Baf. by a single exponential function. Dara are means ± SEM. (B) Left panel, Time courses of endocytosis during stimulation with 400 APs at 20 Hz in control (black), Arf6-KD (red) and rescued (gray) synapses for the same experiments shown in A. Time courses were derived by subtracting the fluorescence trace in the presence of Bafilomycin (ΔFexo) from the trace in its absence (ΔFexo-ΔFendo). Middle and right panels, Rate of exocytosis (EXO) and endocytosis (ENDO) during stimulation were calculated as the area under the curves. Statistical analysis was performed with one-way ANOVA followed by the Bonferroni’s multiple comparison test. *p<0.05, **p<0.01 versus Arf6-KD.

