. 2016 Feb 12;5:e13356. doi: 10.7554/eLife.13356

Figure 1. Substitution of extracellular Na+ with NMDG+ increases TRPV1-mediated currents.

(A) Side view in ribbon representation of the transmembrane domains of two opposing TRPV1 subunits (as indicated by the black arrow, extracellular face on the top, intracellular face on the bottom) in the apo state (refined TRPV1 structural model [Bae et al., 2016]). The dashed boxes denote the location of the two constrictions proposed to serve as gates. Side chains of residues forming the binding site for capsaicin (purple) or determining activation of TRPV1 by protons (blue) are shown as sticks. (B) Representative time-course of whole-cell TRPV1-mediated currents elicited by 100-ms voltage pulses from -90 mV (triangles) to +90 mV (circles) at 300 ms intervals and at room temperature. The colored horizontal lines signal the onset of rapid-solution exchange as indicated by the labels. The dotted red line indicates the zero-current level. (C) Normalized TRPV1 current-voltage (I-V) relations obtained from 1s-duration voltage-ramps, following the same solution-exchange sequence as in (B). The darker curves are the mean and lighter-colored envelopes the standard error (n = 8).

DOI: http://dx.doi.org/10.7554/eLife.13356.003

Figure 1.

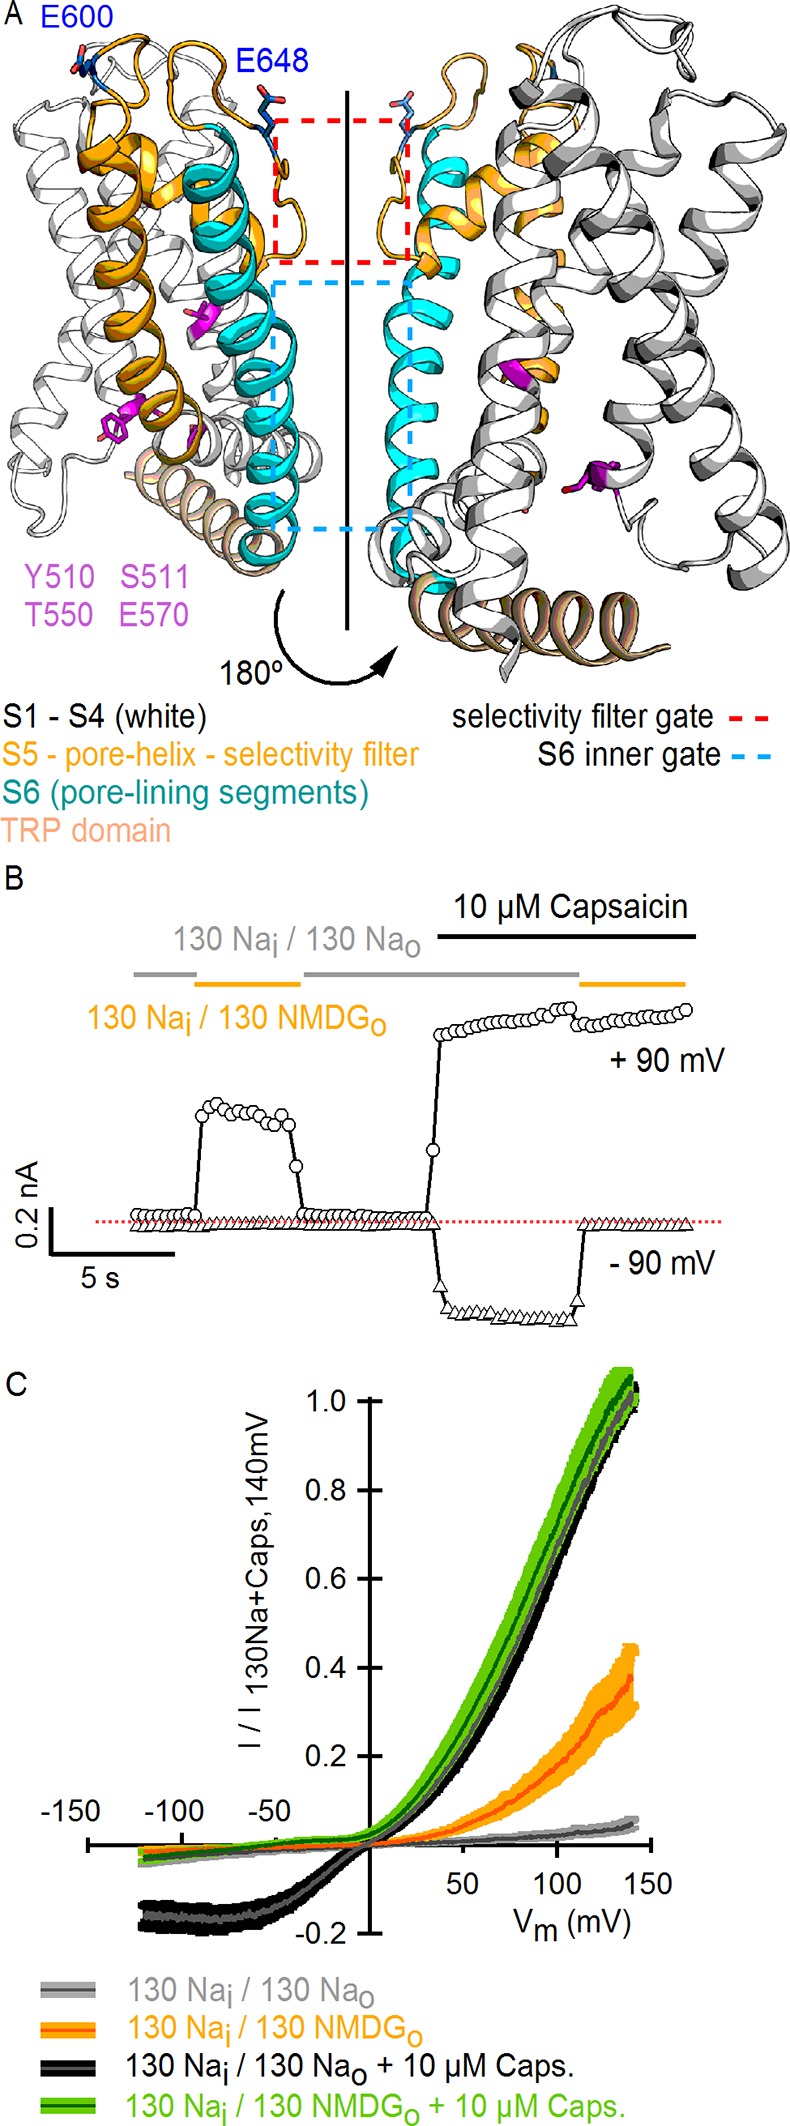
Figure 1—figure supplement 1. Substitution of external Na+ with NMDG+ induces channel rundown at room temperature with high cell-to-cell variability.

Figure 1—figure supplement 1.

(A) Two representative TRPV1 current time courses obtained from a train of voltage ramps in the whole-cell configuration, constructed by plotting the mean currents at -120 (triangles) and +120 mV (circles) for each ramp within the train as a function of time. Rapid switching between extracellular solutions containing either 130 mM Na+ (Nao, gray) or 130 mM NMDG+ (130 NMDGo, yellow) is indicated by the color of the symbols. The rate of channel rundown in the absence of external Na+ exhibited large cell-to-cell variability, as observed when comparing the experiment on the left (prominent inactivation) to the one on the right (modest and slow inactivation). Rundown could not be prevented by adding ATP and/or diC8-PIP2 to the intracellular solution or by maintaining the intracellular milieu intact in perforated patch recordings (data not shown). The dotted red lines indicate the zero-current level. (B) Rundown could be slowed down if cells were kept for longer periods of time in the presence of 130 mM external Na+.

Figure 1—figure supplement 2. Activation of rat TRPV1 channel orthologues by substituting external Na+ with NMDG+.

Figure 1—figure supplement 2.

Representative current families recorded from outside-out patches containing TRPV1 channels from different species (mouse, human and chicken) at room temperature. Currents were elicited by voltage steps of 100 ms duration going from -120 to +140 mV in 10-mV increments, and different solutions were applied using the fast solution-exchange system. The red-dotted lines denote the zero-current level.

Figure 1—figure supplement 3. Comparison of TRPV1 channel I-V relations measured using voltage steps and voltage ramps.

Figure 1—figure supplement 3.

(A) Representative whole-cell TRPV1 current families obtained at room temperature in response to 100-ms voltage pulses from -120 to +140 mV in 10-mV increments and recorded in the absence and presence of external Na+ or NMDG+, with and without saturating capsaicin. The dotted red lines indicate the zero-current level. (B) Superposition of the normalized I-V relations obtained from voltage ramps (continuous curves, Figure 1C) or from families of voltage pulses (crossed circles) as in (A). For the ramps, the dark gray curves are the mean and the colored envelopes the standard error (n = 8). For the pulses, data are shown as mean ± SEM (n = 7). For both ramps and pulses, normalization was done as indicated on the y-axis label.

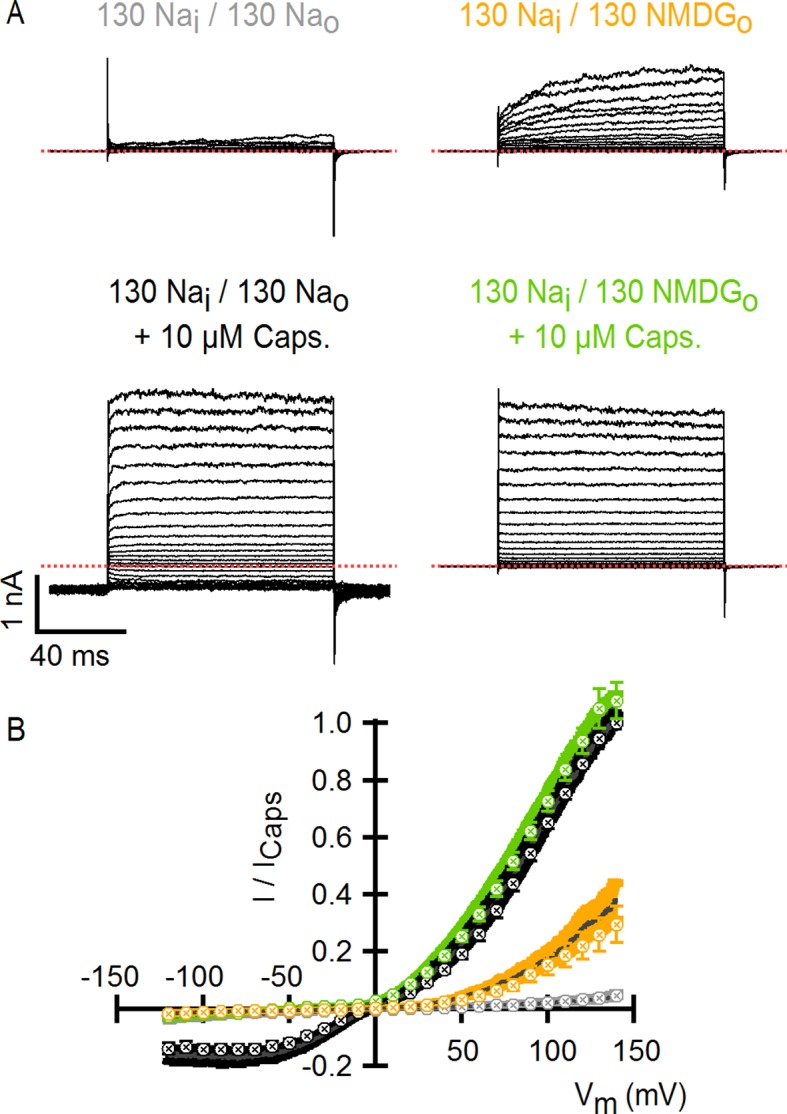
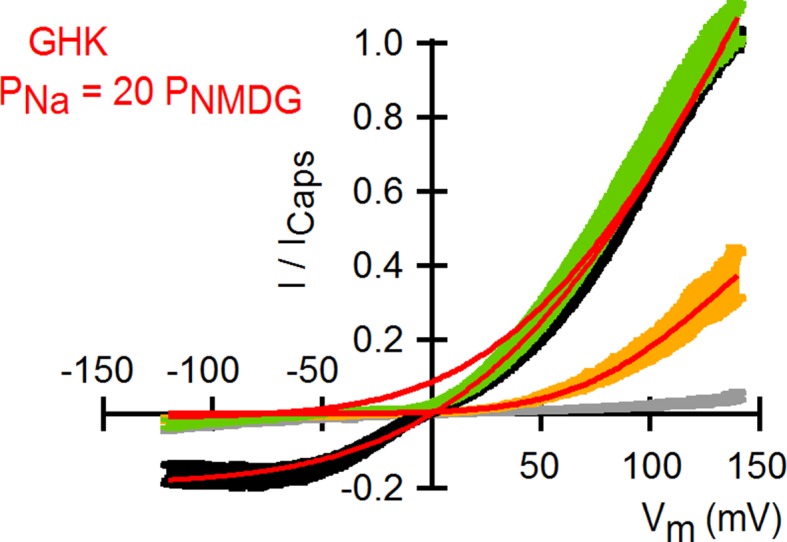
Figure 1—figure supplement 4. Theoretical I-V relations in the presence and absence of external Na+ obtained with the Goldman-Hodgkin-Katz current equation.

Figure 1—figure supplement 4.

Superposition of the I-V relations obtained from voltage ramps (Figure 1C) and theoretical I-V curves calculated using the Goldman-Hodgkin-Katz current equation (red curves) with a permeability of TRPV1 for Na+ ions that is 20-fold larger than that for NMDG+. Theoretical I-V relations were calculated with the following equation: I(V)=N(Po,min+Po,maxPo,min1+exp(zF(VV12)RT)) [PX1zX12VF2RT[X1]i1+exp(zX1FVRT)fPX1zX22VF2RT[X2]o1+exp(+zX2FVRT)],where I(V) is the current as a function of voltage (V), N is the number of channels, Po,minis the minimal open probability at V << 0, Po,max is the maximal open probability at V >> 0, z is the gating charge of the channel, V1/2 is the voltage of half-maximal channel activation, F is Faraday’s constant, R is the gas constant, T is the temperature, PX1 is the permeability of the intracellular cation (i.e. Na+), zX1 and zX2 are the charges of the intracellular and extracellular cations, respectively, [X1]iand [X2]are the molar concentrations of the intracellular (Na+) and extracellular (Na+ or NMDG+) cations, respectively, and f is the permeability ratio for cations 1 and 2 (PX2/PX1). At saturating capsaicin, the parameters used were: Po,min = 0.05; Po,max = 0.9; z = 0.31 e0; V1/2 = 71 mV and f = 1 for 130 Nao or 0.05 for 130 NMDGo. For 130 NMDGo the parameters were: Po,min = 0; Po,max = 0.30; z = 0.72 e0; V1/2 = 99 mV and f = 0.05. A permeability for Na+ of 2.04721 x 10⁻¹⁹ m/s was used.