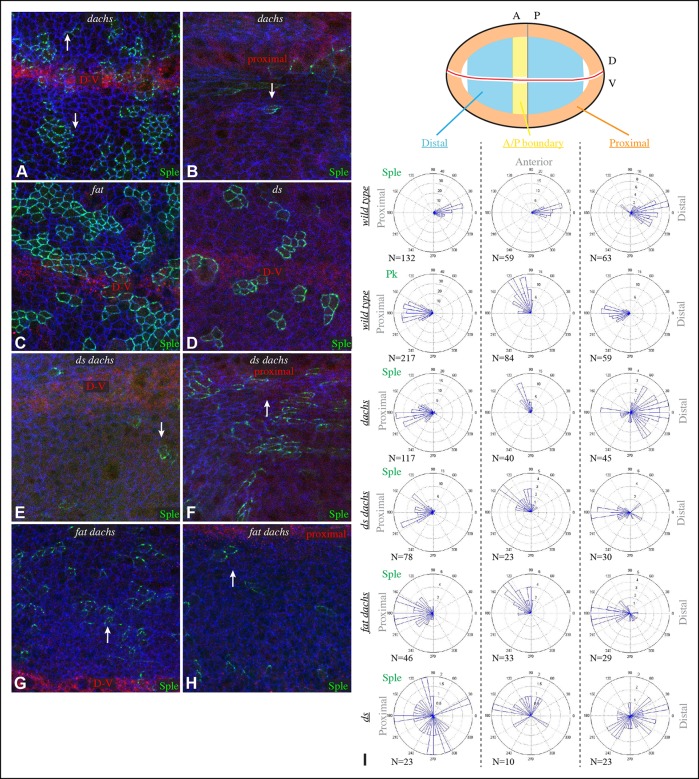
Figure 2. Localization of Sple in Ds-Fat pathway mutants.
(A–H) Portions of wing imaginal discs with clones of cells expressing GFP:Sple (green) in dGC13/ d210 (A and B), ft8/ ftG-rv (C), ds36D/ dsUA071 (D), dGC13 ds36D/ dGC13 dsUA071 (E and F) and dGC13 ft8/ dGC13 ftG-rv (G and H) mutants. Discs were stained for E-cad (blue) and Wg (red). Wg is expressed along the D-V boundary and in proximal rings, the locations of Wg expression shown are indicated. White arrows indicate general direction of Sple polarization. (I) Rose plots summarizing orientation of Sple or Pk in the indicated genotypes, with proximal at left, distal at right, and in the central row, anterior at top. Orientations were scored separately in the three regions depicted in the cartoon, the number of cells scored is indicated by N.

