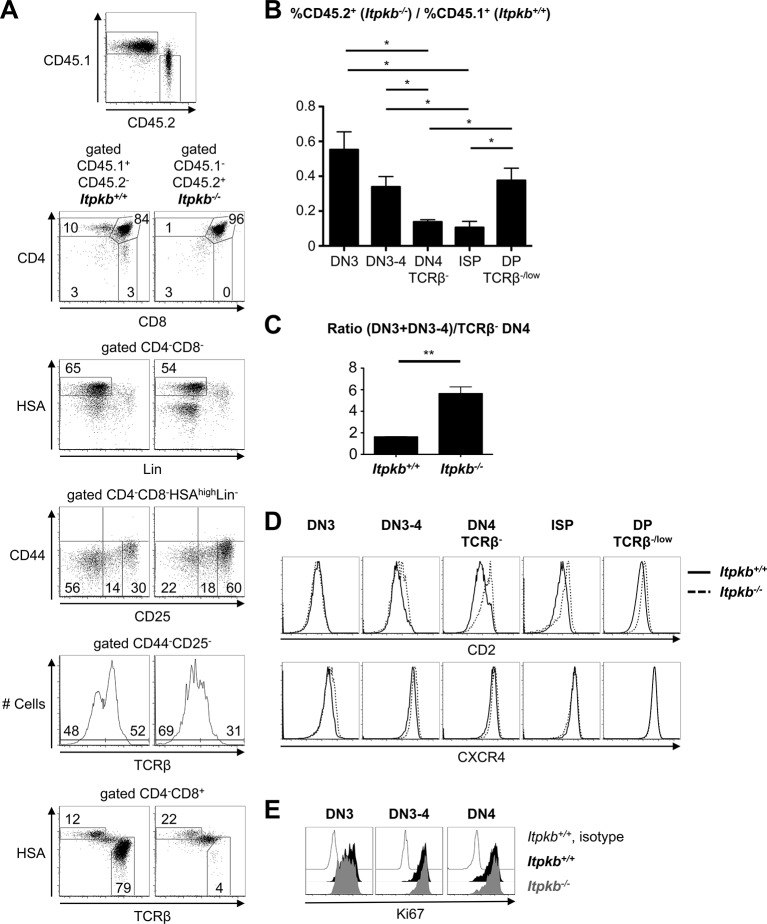
Figure 4. Itpkb controls β-selection cell-autonomously.
B/T cell-depleted BM from CD45.1 Itpkb+/+ and CD45.2 Itpkb-/- mice was mixed at a 1:1 ratio and injected into CD45.1/CD45.2 lethally irradiated hosts. 7 weeks later, thymocytes were analyzed by FACS. (A) Top, thymocyte expression of CD45.1 and CD45.2. The other panels show expression of the indicated markers on CD45.1+CD45.2-Itpkb+/+ or CD45.1-CD45.2+Itpkb-/- donor-derived thymocytes, using the gating strategy in Figure 2A. Numbers denote % cells per gate. (B) Chimerism of the indicated thymocyte subpopulations, expressed as mean ± SEM ratio of CD45.1-CD45.2+Itpkb-/- to CD45.1+CD45.2-Itpkb+/+ donor-derived thymocytes. (C) Mean ± SEM ratio of total DN3 cell numbers to TCRβ- DN4 cell numbers in Itpkb+/+ or Itpkb-/- donor-derived thymocytes. Significance of the indicated comparisons was analyzed as in Figure 2 (n = 3). (D) CD2 and CXCR4 expression on Itpkb+/+ (solid) and Itpkb-/- (hatched) thymocyte subsets in mixed BM chimeras. Representative of 3 independent hosts. (E) Ki67 expression in Itpkb+/+ (black) and Itpkb-/- (gray) DN3, DN3-4 and DN4 cells in mixed BM chimeras. Open histogram, Itpkb+/+ isotype staining negative control. Representative of 3 independent hosts.

