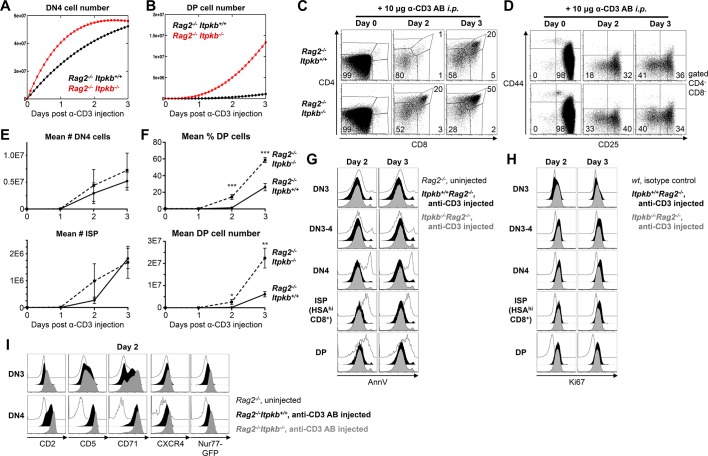
Figure 6. Accelerated differentiation of Itpkb-/- DN3 thymocytes.
(A,B) Mathematically predicted numbers of DN4 (A) and DP cells (B) in Rag2-/-Itpkb+/+ (black) or Rag2-/-Itpkb-/- (red) mice on the indicated days post α-CD3 antibody injection. >98% of thymocytes in Rag2-/- mice are DN3 cells (C,D), and progenitor influx within 3 days is negligible. Thus, we set K = 0 in our model for (A,B). (C,D) CD4/CD8 expression on thymocytes (C) and CD44/CD25 expression on DN cells (D) from Itpkb+/+Rag2-/- or Itpkb-/-Rag2-/- mice before (day 0), or 2 or 3 days post α-CD3 antibody injection. Gates in (D) denote DN1, DN2, DN3, DN3-4 and DN4 cells in clock-wise order, numbers % cells in the DN3 and DN4 gates. Representative of 7 independent experiments. (E) Measured mean ± SEM DN4 cell (upper panel) and ISP (lower panel) numbers in Itpkb+/+Rag2-/- (solid line) or Itpkb-/-Rag2-/- (hatched) mice before (day 0) or 1, 2 or 3 days after α-CD3 injection. Significance of the indicated comparisons was analyzed as in Figure 2. For DN4 cell numbers, n = 4, 4, 6 or 6 Rag2-/- and 4, 4, 5 or 5 Itpkb-/-Rag2-/- mice, respectively. For ISP numbers, n = 6, 5, 7 or 7 Rag2-/- and 4, 4, 6 or 5 Itpkb-/-Rag2-/- mice, respectively. (F) Mean ± SEM DP cell % (upper panel) or number (lower panel) in Itpkb+/+Rag2-/- (solid line) or Itpkb-/-Rag2-/- (hatched) mice before (day 0) or 1, 2 or 3 days after α-CD3 antibody injection. Significance of genotype differences per day was analyzed as in Figure 2. n = 6, 5, 7 or 7 Rag2-/- and 4, 4, 6 or 5 Itpkb-/-Rag2-/- mice, respectively. (G) Annexin V (AnnV) staining of DN3, DN3-4, DN4, HSAhiCD8+ ISP or DP cells from uninjected Rag2-/- (open histograms) or α-CD3 antibody injected Itpkb+/+Rag2-/- (black filled histograms) or Itpkb-/-Rag2-/-(gray filled histograms) mice two (left) or three (right) days post antibody injection. Representative of 3 independent experiments and 3–4 mice per genotype. Uninjected Rag2-/- mice contain dying cells in the DN4, CD8-ISP and DP cell gates due to failed β-selection at the DN3 stage. These serve as positive controls for the Annexin V stain. (H) Ki67 expression in DN3, DN3-4, DN4, HSAhiCD8+ ISP or DP cells from α-CD3 antibody injected Itpkb+/+Rag2-/- (black filled histograms) or Itpkb-/-Rag2-/- (gray filled histograms) mice two (left) or three (right) days post antibody injection. Representative of 2 independent experiments and 3 mice per genotype. Open histograms, day 0 WT isotype control. (I) CD2, CD5, CD71 and CXCR4 surface-levels on, and transgenic Nr4a1/Nur77-GFP expression in DN3 or DN4 thymocytes from uninjected Rag2-/- (open histograms) or α-CD3 injected Itpkb+/+Rag2-/- (black) or Itpkb-/-Rag2-/- (gray) mice 2 days post injection. The <1% CD44-CD25- negative control cells in uninjected Rag2-/- mice are non-T cells. Representative of ≥3 independent experiments.

