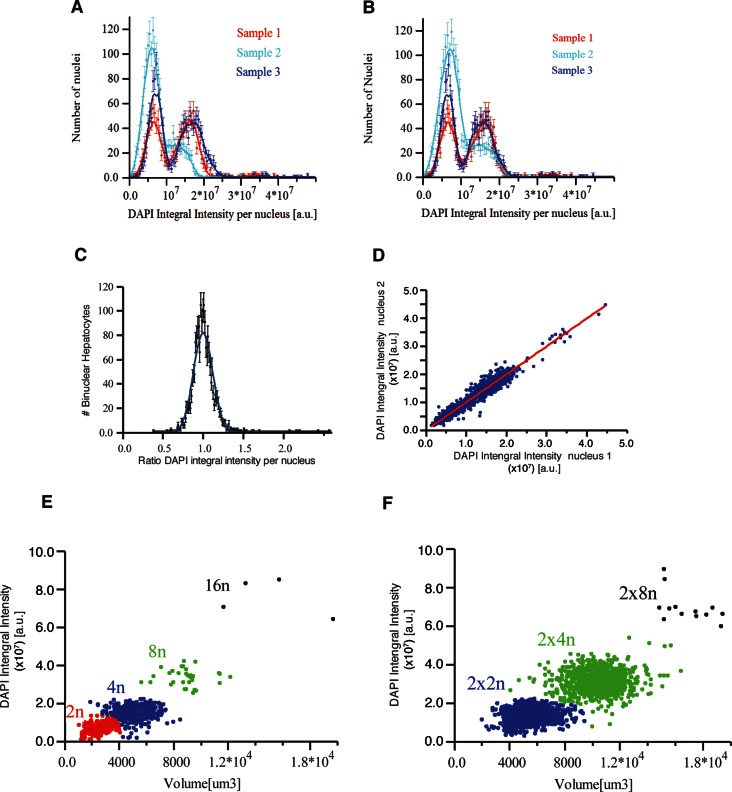
Distribution of DAPI integral intensity per nucleus calculated for each sample (A) before and (B) after normalization. We found scaling (stretching) factors 1.19 and 0.93 for the second and third samples, respectively. (C, D) DNA content in bi-nuclear hepatocytes. DAPI integral intensity per nucleus was calculated for each nucleus of the cells. (C) The distribution of the ratio between DAPI integral intensity of the two nuclei in each cell. It follows a normal distribution with mean value 1.0 ± 0.21 (mean ± SD). (D) The dependency between DAPI integral intensity of the two nuclei in bi-nuclear cells. They show a linear dependency (R2 = 0.945433) with a slope of 0.995, showing that both nuclei have the same DNA content in bi-nuclear hepatocytes. (E, F) Scatter plot of the volume versus DAPI integral intensity of (E) mono-nuclear and (F) bi-nuclear hepatocytes. The results of the hierarchical clustering of (E) mono-nuclear and (F) bi-nuclear hepatocytes are shown. Four (2n, 4n, 8n, 16n) and three (2×2n, 2×4n, 2×8n) populations were found for mono-nuclear and bi-nuclear hepatocytes, respectively. The classification was performed using volume and DAPI integral intensity per cell. We used an agglomerative hierarchical cluster algorithm and tested several distances for the dissimilarity calculation and different methods for the clustering. We found that the standardized Euclidean distance with the Ward method yielded the best results.


