. 2016 Jan 13;5:e10415. doi: 10.7554/eLife.10415

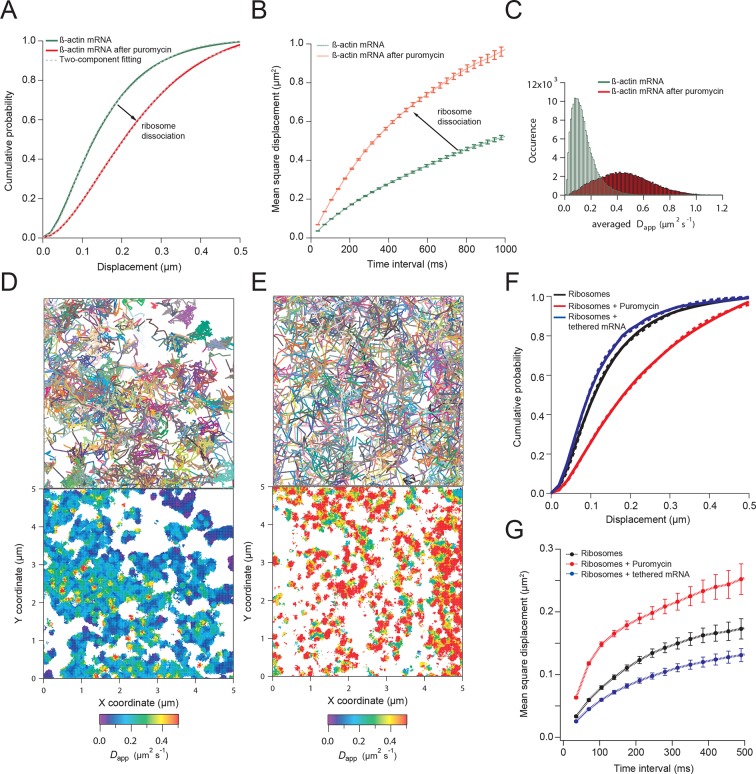
Figure 2. β-actin mRNA trajectories are faster and less-corralled after ribosome dissociation via puromycin treatment.

(A) Treatment with puromycin dissociates ribosomes from mRNA and shifts β-actin mRNA trajectories significantly towards faster diffusion (arrow). (B) Mean square displacement curves also indicate a shift towards faster movement (arrow) after puromycin treatment. (C) The histogram of average apparent diffusion coefficients shows the transition of the population to a faster movement profile of β-actin mRNA after ribosome dissociation. (D) A subset of trajectories from mRNA tracking and the resulting diffusion map indicates areas of slower movement. (E) After puromycin treatment most trajectories shift towards faster movement as reflected in the diffusion heat map. (F) sptPALM of ribosomes reflects similar movement changes after puromycin treatment. Immobilizing a subset of β-actin mRNA at focal adhesions with MS2-vinculin tethering shifts the ribosome CDF curve to the left, signifying tracked ribosomes are interacting with β-actin mRNA in the adhesion compartment. (G) The ribosome trajectory changes after puromycin and in mRNA tethering experiments are likewise reflected in MSD curves.

DOI: http://dx.doi.org/10.7554/eLife.10415.010

Figure 2.

Figure 2—figure supplement 1. β-actin mRNA trajectories are faster and less-corralled after addition of hippuristanol.

Figure 2—figure supplement 1.

(A) Treatment with hippuristanol inhibits translational initiation and shifts β-actin mRNA trajectories significantly towards faster diffusion (arrow). The cumulative distribution function of all 28,065 trajectories obtained from three cells in steady state (green curve) is best fit by a two-component fit (dashed curve, 43% in fast component). The cumulative distribution function of 26,921 β-actin mRNA trajectories of the same three cells after addition of hippuristanol (red curve) is best fit by a two-component fit with a shift towards the faster component (dashed curve, 72% in fast component). (B) The corresponding mean square displacement curves also indicate a shift towards faster movement after hippuristanol addition (arrow). (C) A map of the local apparent diffusion coefficients from all 10,084 β-actin mRNA trajectories. (D) A map of the local apparent diffusion coefficients from all 11,851 β-actin mRNA trajectories of the same cell as in (C) recorded 20 min after hippuristanol addition reflects the global shift towards faster β-actin mRNA movement after inhibition of translational initiation.
Figure 2—figure supplement 2. Cumulative distribution function analysis of ribosome diffusion.

Figure 2—figure supplement 2.

(A) The cumulative distribution function of ribosomes for cells in steady state (solid curve) is best fit by two-components (dashed curve) composed of a slow (56%) and a fast (44%) diffusion component (dash-dotted curves). A one-component single-exponential fit (dotted curve) does not adequately fit the experimentally obtained CDFs. (B) The cumulative distribution function of ribosomes after addition of puromycin is best fit by a two-component fit with a shift towards the faster component (73% fast). (C) The cumulative distribution function of ribosomes with β-actin mRNA tethered to focal adhesions (see Figure 3—figure supplement 1) is best fit by a two-component fit with a shift towards the slower component (63% slow). (D) The cumulative distribution function of ribosomes co-moving with β-actin mRNA (green curve) is best fit by a two-component fit (62% slow). Ribosomes that were not co-moving with ribosomes are also best fit by a two-component fit (in purple), but the ratio shifts towards the faster diffusion component (54% slow). (E) MSD curves of co-moving ribosomes (in green) depict increased corralling and an exploration area of 0.06 μm2. MSD curves of non-co-moving ribosomes depict faster diffusion behavior and are less corralled (purple curve).