. 2016 Jan 13;5:e10415. doi: 10.7554/eLife.10415

Figure 3. Cellular maps of areas with increased β-actin translation.

(A) Super-resolution PALM density map composed of all 63,940 β-actin mRNA localizations from 6,235 trajectories. The PALM density plot was generated with VISP (El Beheiry and Dahan, 2013) from a simultaneous two-color movie with 500 consecutive frames. (B) Corresponding super-resolution PALM density map of all 19,420 ribosome localizations from 2,811 trajectories. (C) A map of the local apparent diffusion coefficients from all 6,235 β-actin mRNA trajectories. (D) A map of the local apparent diffusion coefficients from the 300 trajectories that were observed to be co-moving. The red arrows mark areas of enriched ribosome association with slowly diffusing β-actin mRNA. (E) Tracking of ribosome trajectories in cells where β-actin mRNA is tethered to focal adhesions. Super-resolution PALM density map composed of all detected localizations (1827) from 215 trajectories from 500 consecutive frames of ribosome imaging (see Video 7). (F) In shades of pink, overlay of the 33 trajectories (15.4% ) that co-localize with the focal-adhesion marker with tethered β-actin mRNA. (G) A map of the apparent diffusion coefficients of co-localized ribosome trajectories exhibits predominately slow diffusion characteristics when mRNA is tethered to focal adhesions. The red arrows mark the hotspots where the tethered mRNA is being actively translated.

DOI: http://dx.doi.org/10.7554/eLife.10415.014

Figure 3.

Figure 3—figure supplement 1. Tracking of individual ribosome molecules with β-actin mRNA tethered to focal adhesions.

Figure 3—figure supplement 1.

(A) The schematic depicts the side view of a fibroblast leading edge with focal adhesions integrating the mRNA tethering construct (vinculin fused to the MS2 capsid protein). All β-actin mRNA tagged with 24 MS2 binding sites will tether directly to the adhesions. Ribosomes tagged with PATagRFP were visualized and tracked at tethering sites. (B) The distribution of apparent diffusion coefficients shifts to a slower population when β-actin mRNA is tethered to focal adhesions. This implies that a substantial fraction of ribosomes interacts with β-actin mRNAs. This population significantly decreases after puromycin treatment.
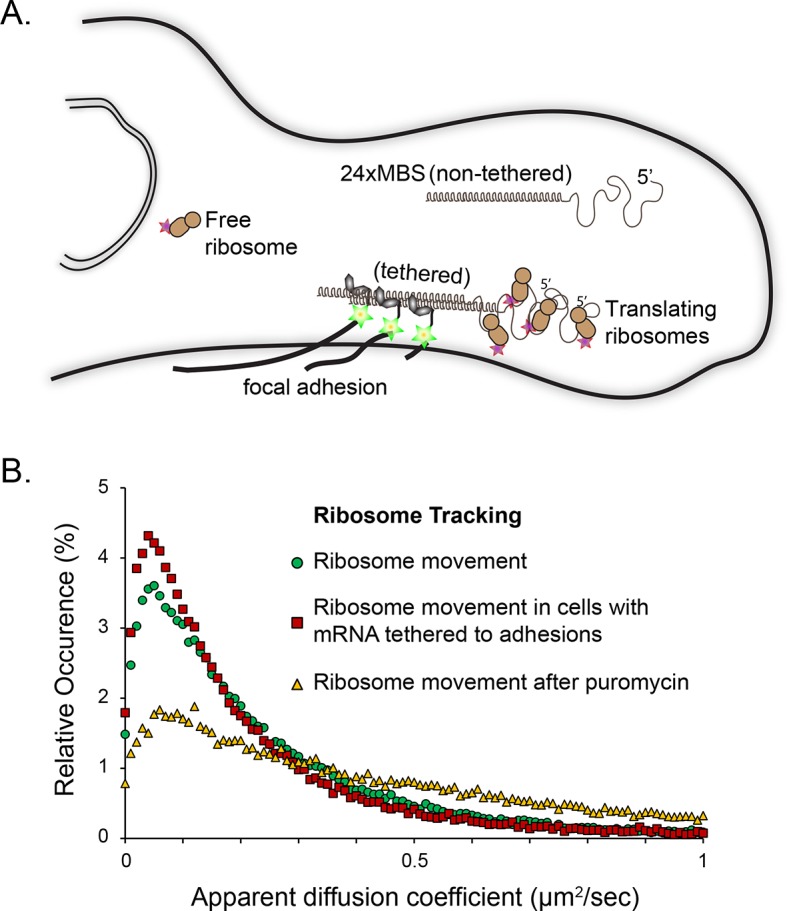
Figure 3—figure supplement 2. Diffusion characteristics of β-actin mRNA co-moving with ribosomes and without ribosomes.

Figure 3—figure supplement 2.

(A) β-actin mRNAs that co-move with ribosomes exhibitslower apparent diffusion coefficients. (B) The mean square displacement curve of co-moving β-actin mRNA trajectories displays a shift towards corralled movement.
Figure 3—figure supplement 3. mRNA/ribosome colocalization statistics in the absence and presence of puromycin.

Figure 3—figure supplement 3.

We generated a matrix of the distances dmRNARibobetween all detected mRNA particles and all detected ribosome particles, and computed the corresponding histogram P(dmRNARibo). We then normalized the distance histogram to account for the fact the area covered by each distance bin grows with dmRNARibo, and plotted the resulting normalized distribution of dmRNARibo, equivalent to the average density of ribosome spots observed as a function of distance from an mRNA detection. If mRNAs and ribosomes do not colocalize, we would randomly detect ribosomes at all positions in the cell without regard for mRNA positions and therefore we would expect to observe a flat distribution for dmRNARibo. In the case of mRNA/ribosome colocalization, we would expect an enrichment of short distances corresponding to comoving trajectories. Left panel: distribution of distances dmRNARibo in the vicinity of focal adhesions observed in untreated cells (dataset from Figure 4). The distribution for the entire dataset (gray histogram) consists of a peak of short dmRNARibo values (<3 pixels) above a flat baseline. The peak at short distances is the signature of colocalized mRNA/Ribosome trajectories, while the baseline reflects the concentration of fluorescent ribosomes non-associated with detected Actin mRNA molecules. We overlaid the distribution of distances dmRNARibo generated from the colocalized trajectories selected by our co-movement algorithm (red line). The algorithm efficiently selects the peak of colocalized trajectories. Right panel: distribution of distances dmRNARibo observed in cells treated with puromycin (dataset from Figure 2). The distribution for the entire dataset (gray histogram) consists of essentially a flat baseline, with a modest increase at short distances. This result reflects the almost entire dissociation of ribosomes from mRNAs following puromycin treatment. The co-movement algorithm accordingly selects a very small fraction of colocalized trajectories.