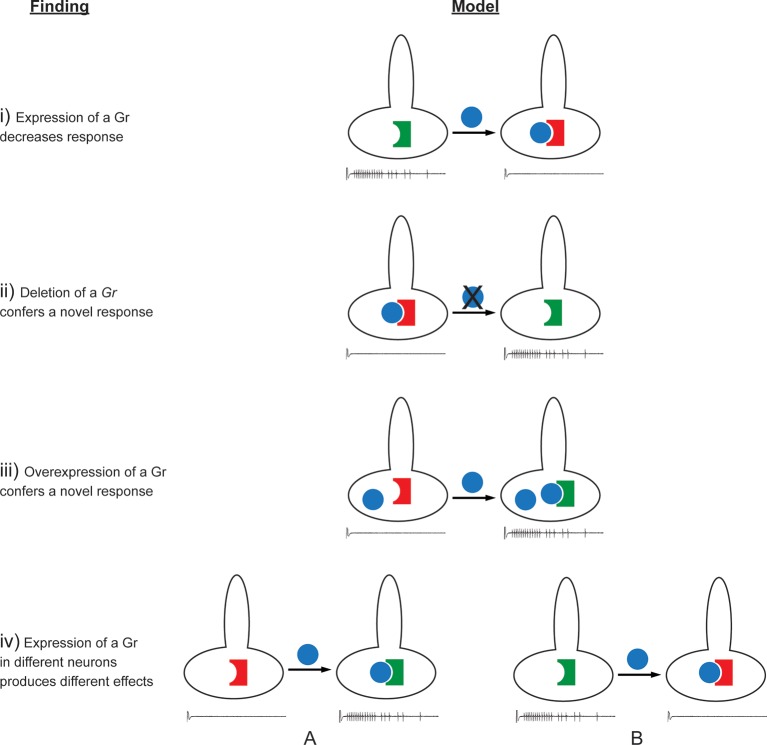
Figure 12. Findings and models.
Four findings of this study are indicated, along with one possible model to explain each. i) Expression of a Gr, indicated by the blue sphere, decreases the response to a tastant, represented by the traces below. One possible model is that the expressed Gr (blue sphere) interacts with another, active Gr (green) and inhibits it (represented by its conversion from a green, active Gr to a red, inactive Gr). ii) Deletion of Gr59c (blue sphere with X) leads to an increased response. One possible model is that in wild type, the Gr inhibits an endogenous Gr (red). Removal of the Gr allows the inactive Gr (red) to become active (green). iii) Overexpression of a Gr, in a neuron that contains the Gr endogenously, induces a response that is not observed in wild type. One model is that above a certain concentration threshold of the Gr, it is able to bind and convert another Gr from an inactive (red) to an active (green) form. iv) Expression of a Gr in two different neurons, 'A' and 'B,' produces different results. The neuron at left shows an increase in response to a tastant whereas the neuron at the right shows a decrease. One model is that in the A neuron, the expressed Gr (blue) binds to an inactive Gr (red) specific to neuron A, and activates it (green). By contrast, in the B neuron, the expressed Gr (blue) binds to a different Gr (green) specific to neuron B, and inactivates it (red).

