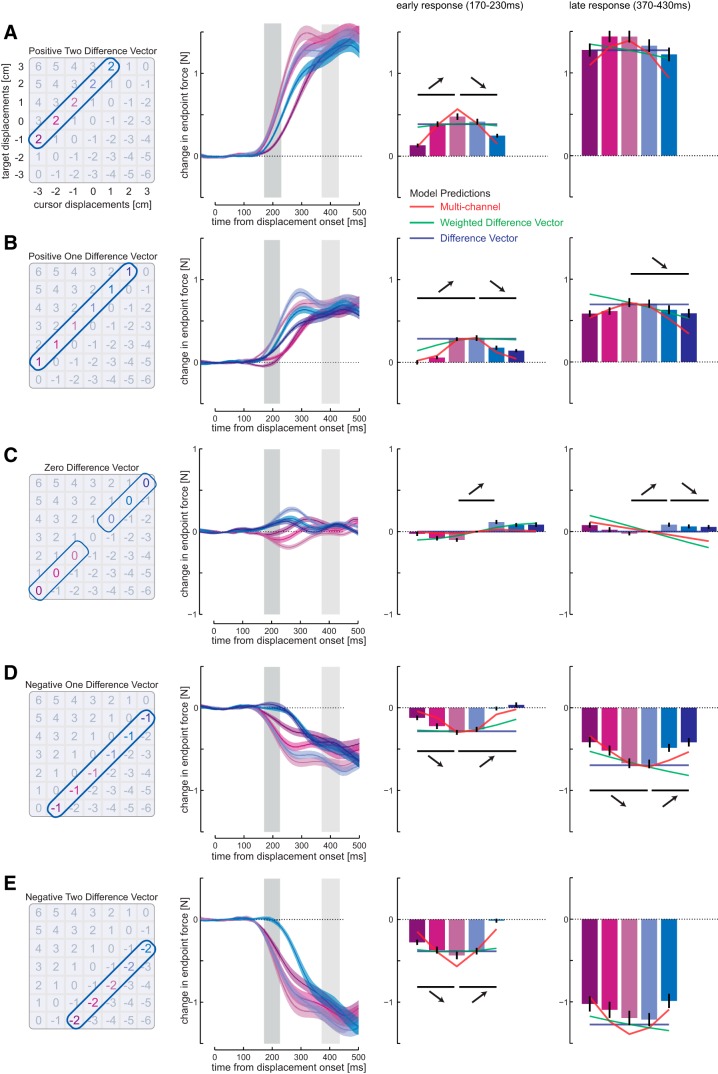
Figure 3.
Responses to conditions with equal difference vectors. A, Left, Conditions with +2 cm difference vector. Middle left, Mean force responses (solid line) and SEM (shaded region) across all subjects. Middle right, The mean (±1 SEM) force responses over the early interval (dark gray shaded time interval, 170–230 ms). The horizontal lines indicate statistical differences (A, E, p < 0.005; and B–D, p < 0.0033; Bonferroni-corrected for multiple comparisons) between conditions that have been selected to demonstrate that the responses are nonmonotonic, and the corresponding arrows indicate the direction of the difference. Colored lines represent the predicted mean force responses from each of the three models: difference vector (blue), weighted difference vector (green), and multichannel model (red). Note that these predictions are based only on the responses to the isolated target and cursor perturbations. Right, The force responses over the later interval (light gray shaded time interval, 370–430 ms). B, Difference vector of +1 cm. C, Difference vector of 0 cm. D, Difference vector of −1 cm. E, Difference vector of −2 cm.

