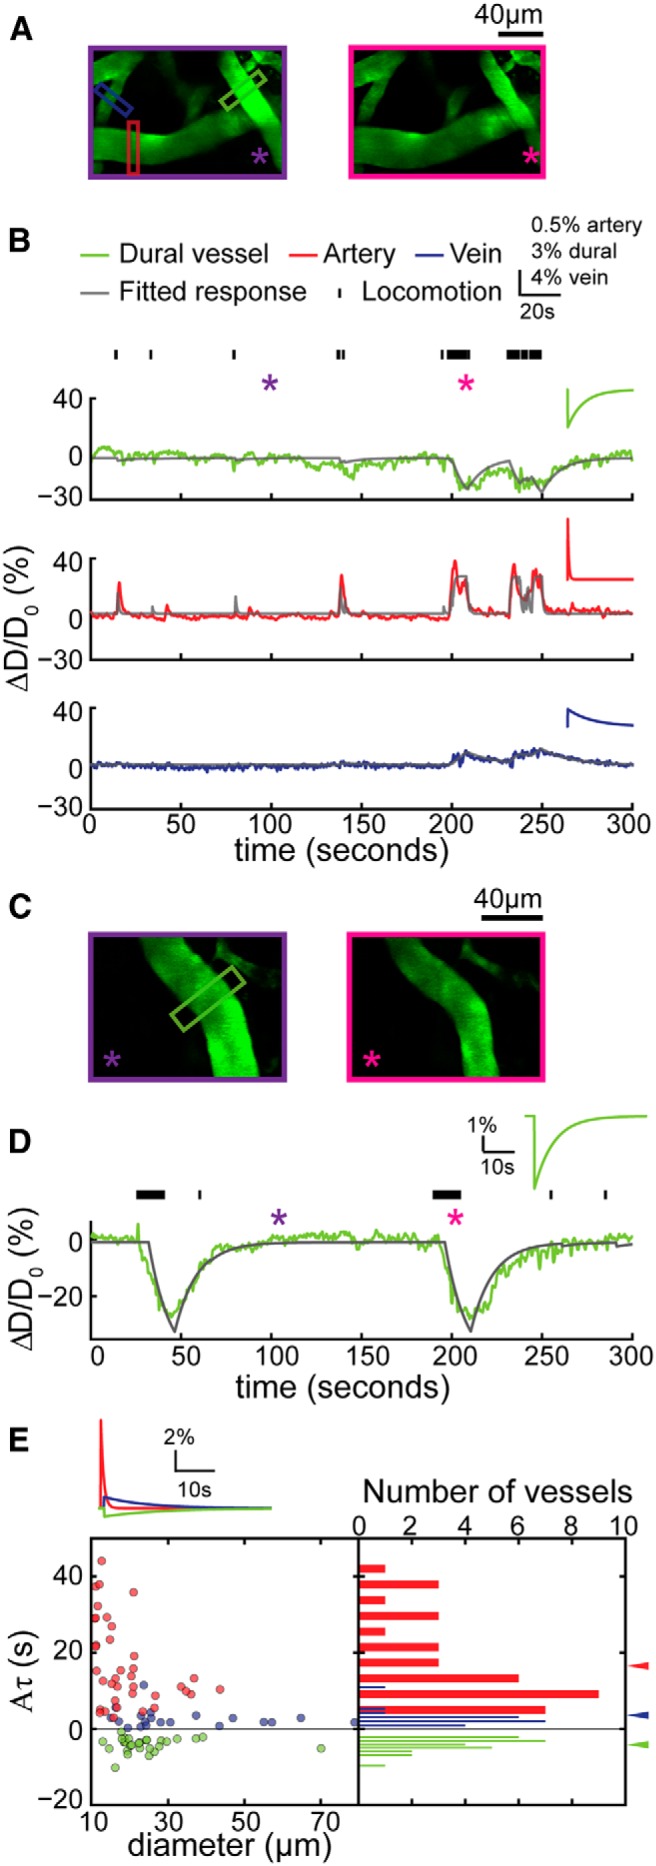
Figure 3.

Dural vessels in the visual cortex also constricted during locomotion. A, 2PLSM images of the vasculature in the visual cortex during periods of quiescence (left, enclosed by purple box) and locomotion (right, enclosed by magenta box). Green, red, and blue boxes denote the location where the dural vessel, pial artery, and vein diameters were measured. B, Time courses of diameter changes of the measured three vessels in A (top, dural vessel; middle, pial artery; bottom, pial vein). Tick marks on the top denote locomotion events. Purple and magenta asterisks indicate the time points of quiescence and locomotion images in A, respectively. Gray lines show the fitted response for each of the three vessels (correlation coefficient of dural vessel, cc = 0.63; artery, cc = 0.56; vein, cc = 0.59). Insets are the impulse responses by model fitting of the three vessels, respectively. C, 2PLSM images of a second example dural vessel over the visual cortex. Left, Image taken when the animal was stationary. Right, Image taken when the animal was locomoting. D, Time course of diameter changes (green line) of the measured dural vessel in C. Black tick marks denote locomotion events. Purple and magenta asterisks indicate the time points of the frames used in C. The gray line shows the fitted response (A, −0.50; τ, 12.11 s; td, 5.31 s, cc = 0.87). Inset shows the impulse response by model fitting of the dural vessel. E, Summary of the values of the fitted impulse response integrated area (Aτ) of the impulse response of all the imaged vessels in the visual cortex (n = 7 mice). Green, red, and blue arrowheads indicate the mean Aτ for dural vessels, pial arteries, and pial veins, respectively. The integrated dilation was larger in arteries (16.72 ± 11.11 s) than in veins (2.71 ± 2.44 s, p = 8.72 × 10⁻⁷, paired t test), and integrated dural vessel response was significantly negative (−4.13 ± 1.89 s, significantly smaller than 0, p = 1.83 × 10⁻¹⁴). Inset shows the averaged impulse responses of each vessel type.
