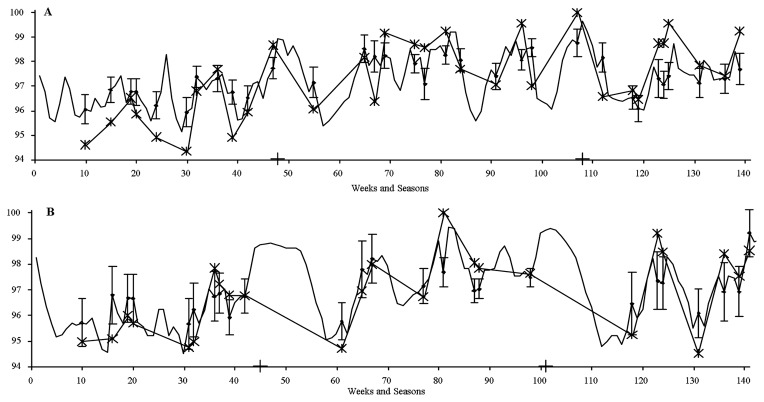
FIGURE 3.
Real and modeled performance for subject 1 (A) and subject 7 (B). Performance in vertical axis is expressed in % of the personal record. Time in horizontal axis is expressed in weeks and seasons (crosses separate 1st from 2nd and 2nd from 3rd seasons). Real performance is indicated with stars linked by straight lines. Modeled performance is indicated by an irregular prediction curve and by diamonds for weeks where an actual performance took place. The 95% confidence intervals for the last case are also represented. For subject 1, the pattern of modeled performance is similar to that of real performance. Inversely, for subject 7, optimal modeled performance was situated shortly after the main seasonal competition, corresponding to the last event of the first and second season (weeks 40 and 98), indicating probably the need of a longer recovery.

