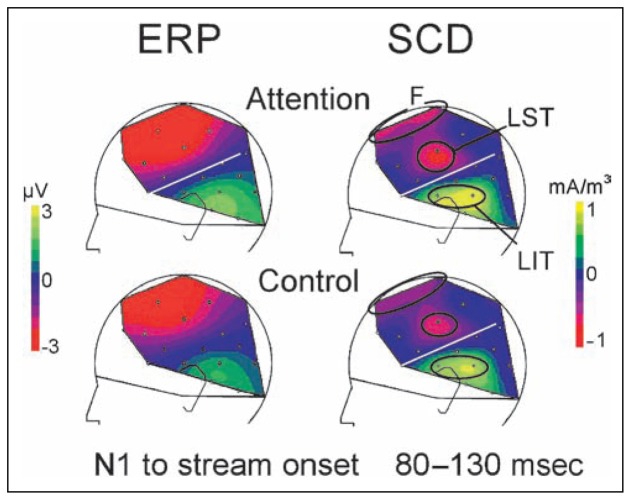
Figure 1.
Stream-onset N1 topographies. Left hemisphere ERP and SCD maps (mean value between 80 and 130 msec, 14 subjects) in attention and control conditions. SCD allows to better disclose temporal and frontal components. Black ovals indicate electrode groups chosen for the analysis: fronto-central current sink (F), left superior temporal current sink (LST), and left inferior temporal current source (LIT). Very similar topographies were obtained over the right hemisphere and symmetrical electrode groups were chosen for the right temporal components.

