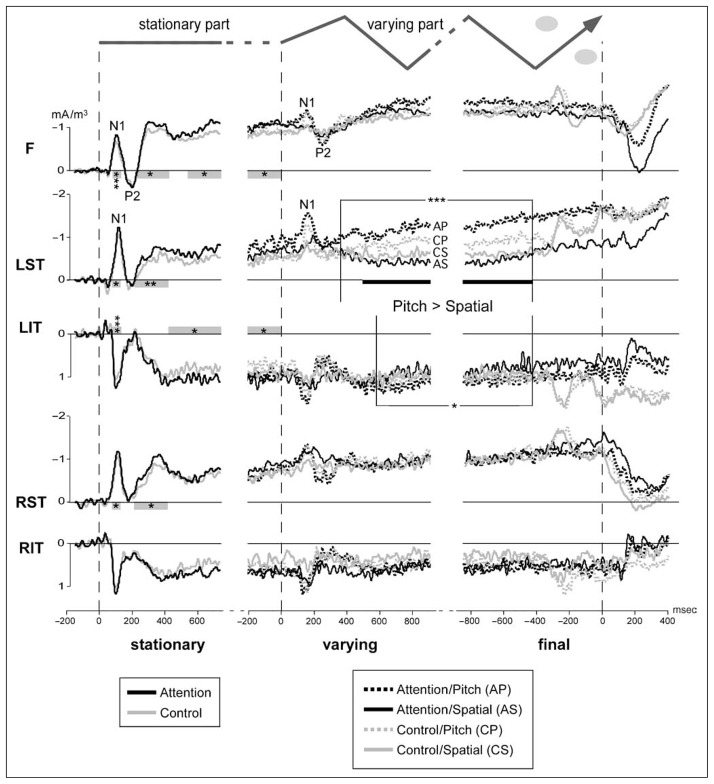
Figure 3.
Temporal and frontal SCD time courses. Mean SCD curves (14 subjects) are drawn over the three analysis periods (defined in Figure 6C) for the frontal (F), left superior and inferior temporal (LST and LIT, respectively), and right superior and inferior temporal (RST and RIT, respectively) electrode groups. The time structure of the stimulus is shown at the top of the figure (gray ovals represent additional noise-bursts used in the control task). During the stationary part, only mean attention (A) and control (C) curves are drawn, whereas in the varying part all conditions are depicted with different line symbols. The evoked N1/P2 complex to auditory stream onset is clearly visible at all electrode groups. N1/P2 to acoustic variations onset can also be noticed, although less pronounced. Note the polarity reversal throughout the stimulus duration between superior and inferior temporal components bilaterally. Significant differences between the attention and the control conditions are indicated by gray bars (ANOVA: *p < .05, **p < .01, ***p < .001). During the varying part, the left temporal components show a significantly more pronounced sustained response for pitch (AP and CP) than for spatial variations (AS and CS) with stars symbolizing the level of significance (ANOVA: *p < .05, ***p < .001). The black horizontal bars at the LST site indicate interaction effects between attention and acoustic variation (p < .05).

