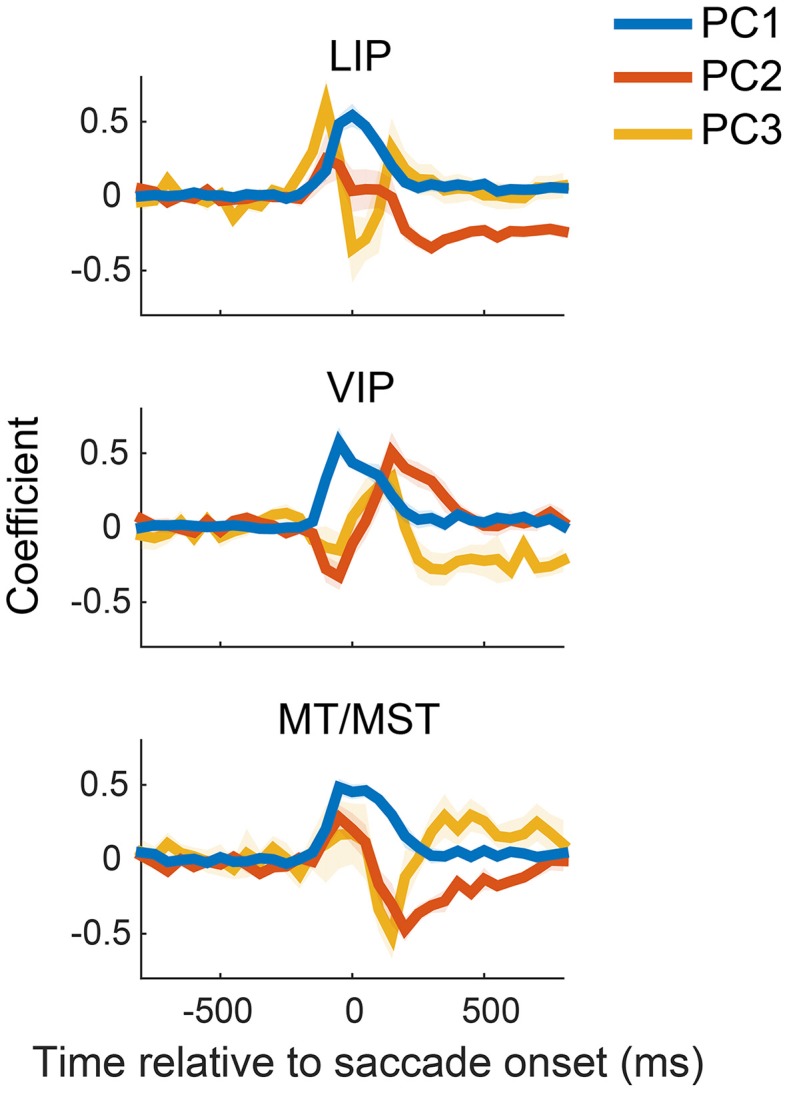
Figure 2.

Principal component analysis of neural activity related to saccade direction. The first three components (PC 1-3) for each of the cortical areas are plotted relative to saccade onset. Components are ordered by decreasing contribution to the total variance (i.e., PC1 explained the most variance). These components reveal a variety of peri-saccadic effects of neural activity, including broad enhancement and suppression and biphasic modulations. The shaded regions represent standard errors, and were obtained by repeating the PCA on 1000 bootstrapped samples of neurons (i.e., resampling neurons). LIP, lateral intraparietal area; VIP, ventral intraparietal area; MT/MST, middle temporal and medial superior temporal areas.
