Figure 1.

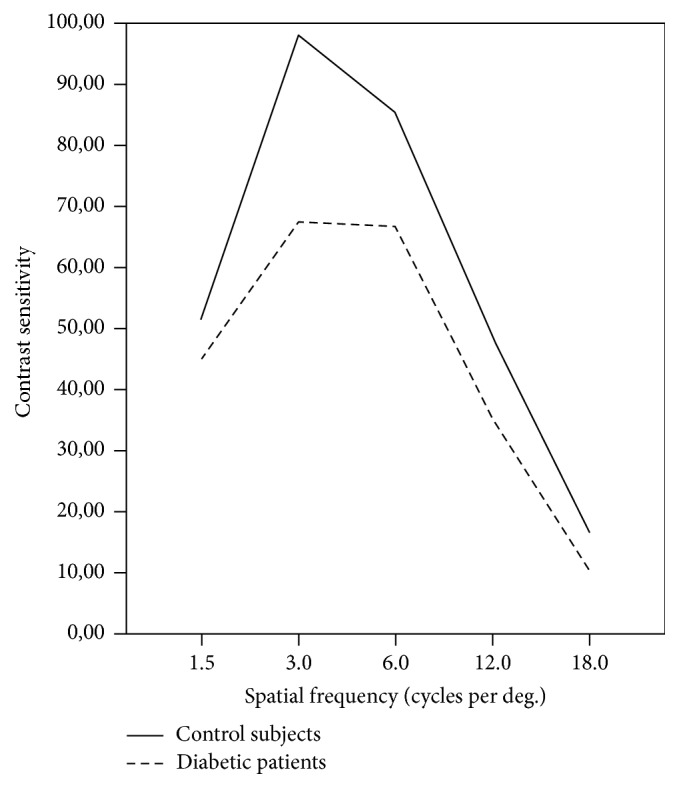
Contrast sensitivity function between diabetic patients (solid line) and control subjects (dashed/dotted line) (p > 0.05).

Contrast sensitivity function between diabetic patients (solid line) and control subjects (dashed/dotted line) (p > 0.05).