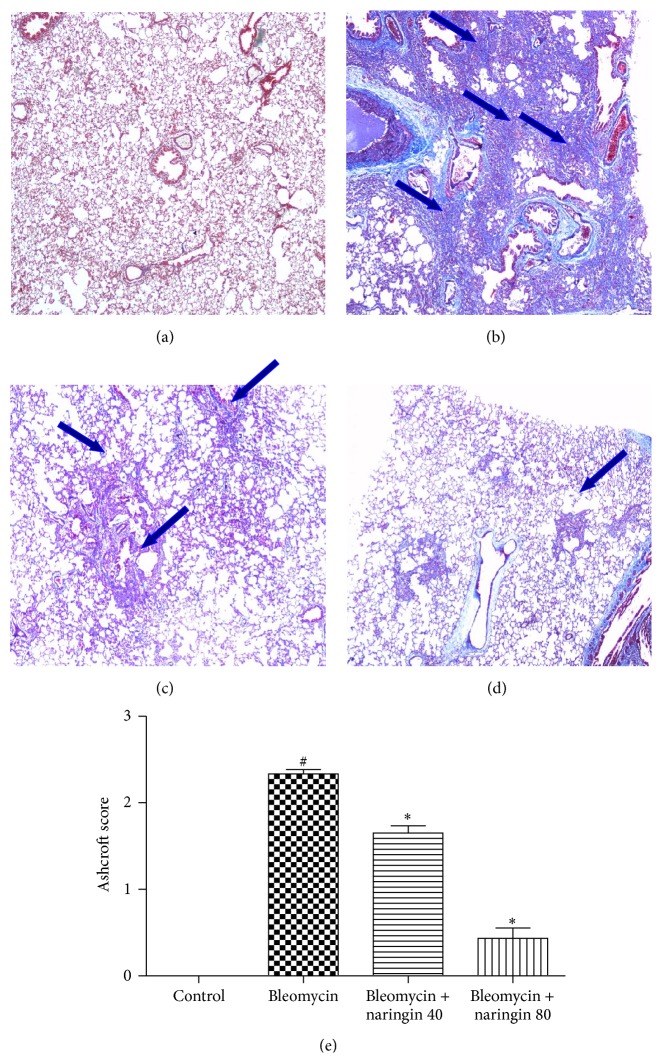
Figure 4.
Photomicrographs of Masson's trichrome stained lung tissues from each group. (a) Control group: normal appearance of lung parenchyma (Grade 0); (b) bleomycin group: severe distortion of structure and large fibrous areas (Grades 6-7); (c) bleomycin + naringin 40 group: increased fibrosis with definite damage to lung architecture and formation of fibrous bands (Grades 4-5); (d) bleomycin + naringin 80 group: minimal fibrous thickening of alveolar or bronchiolar walls (Grade 1) (MT ×40). (e) The quantitative evaluation of fibrotic changes in control, bleomycin, naringin 40, and naringin 80 groups by Ashcroft scoring. # p < 0.05, compared with control group; ∗ p < 0.05; compared with bleomycin group. Arrows show areas with fibrotic changes. For statistical analysis, one-way ANOVA test followed by Tukey-Kramer multiple comparison test was used.

