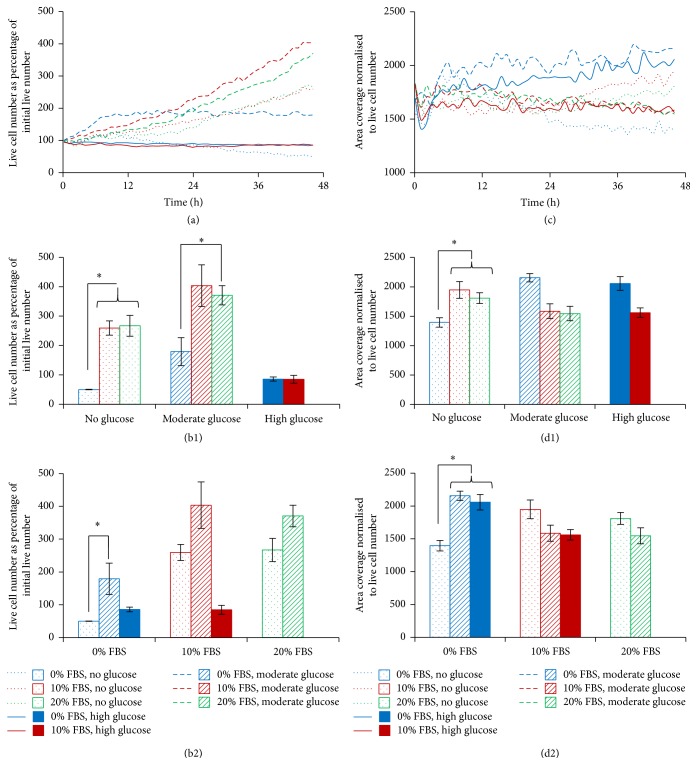
Figure 2.
Monitoring the response of bovine NP cell cultures to changes in FBS and glucose concentration over 48 hours. (a) Temporal analysis for live cell number, expressed as the percentage of the initial live cell number. (b) Live cell number, expressed as a percentage of the initial live cell number at the final time point (±SEM), comparing FBS levels within glucose subgroup (b1) and comparing glucose levels within FBS subgroup (b2). (c) Temporal analysis for area coverage normalised to live cell number. (d) Cell area, normalised to live cell number, at the final time point (±SEM), comparing FBS levels within glucose subgroup (d1) and comparing glucose levels within FBS subgroup (d2). ∗ represents a statistically significant difference of p < 0.05.

