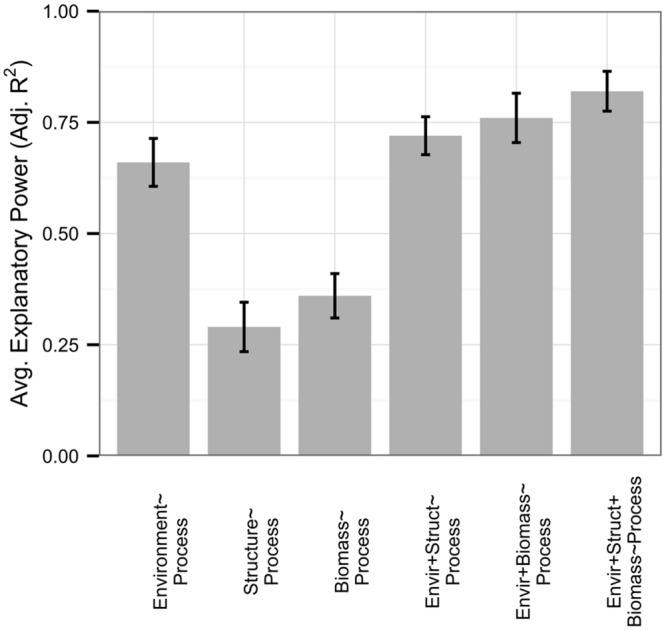
FIGURE 3.

Rates of respiration (n = 26) were well-explained by all predictor sets relative to the full dataset. In this figure, we present microbial biomass in addition to microbial community structure, with standard errors represented as error bars. Microbial community structure and biomass independently had low explanatory power compared to environmental variables; however, they were largely uncorrelated with each other and provided greater model improvement when added to environmental variables in conjunction than when added independently.
