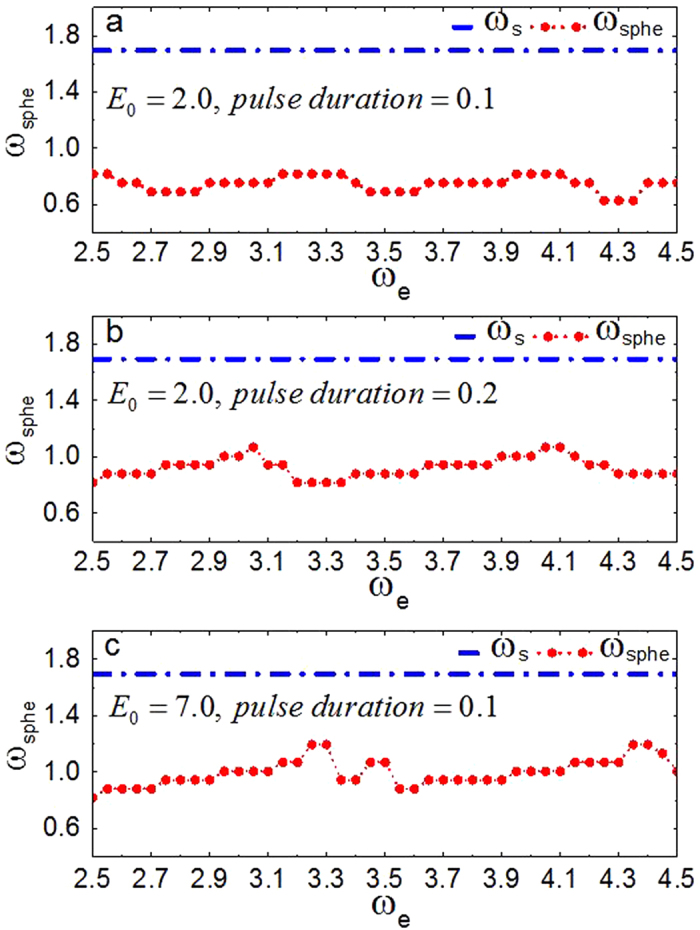
Figure 3. The relationship between the frequencies of the induced spherical wave and of PDCEF.

The pulse duration and the strength of PDCEF vary in different subgraphs. (a) E0 =2.0 and pulse duration is 0.1, (b) E0 = 2.0 and pulse duration is 0.2 and (c) E0 =7.0 and pulse duration is 0.1. The dashed line with solid circles represents the frequency of the induced spherical wave  in a quiescent medium. The dash-dotted line represents the frequency of the pinned scroll wave
  .
.
