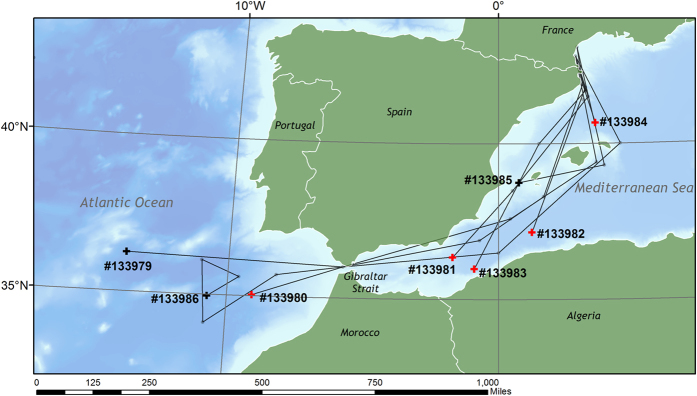
Figure 1. Map of western Mediterranean Sea and Eastern Atlantic Ocean, showing the approximate tracks of the individual tagged eels, based on a restricted number longitude and latitude estimates, see Methods for details.
Crosses mark the pop-up position of each tag. Black crosses denote the tags that surfaced at the programmed date, while red crosses indicate the pop-up positions of tags attached to eels taken by predators. The map was drawn in Esri ArcMap 10.1, using GEBCO bathymetry ( http://www.gebco.net/) and ESRI map ( http://www.esri.com/software/arcgis) data.

