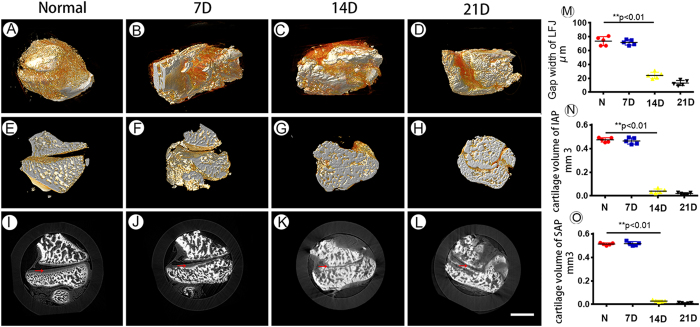
Figure 4. The 3D morphological changes of the LFJ during the degeneration process.
(A–D) 3D images of the normal LFJ and degenerated LFJ at different stages, 7, 14 and 21 days after injection with MIA. (E–H) Sagittal views of the LFJ at different stages after injection with MIA. (I–L) The corresponding transverse slice images of the LFJ. (M–O) The joint gap width and cartilage volume of the IAP and SAP. Bar = 2 mm.

