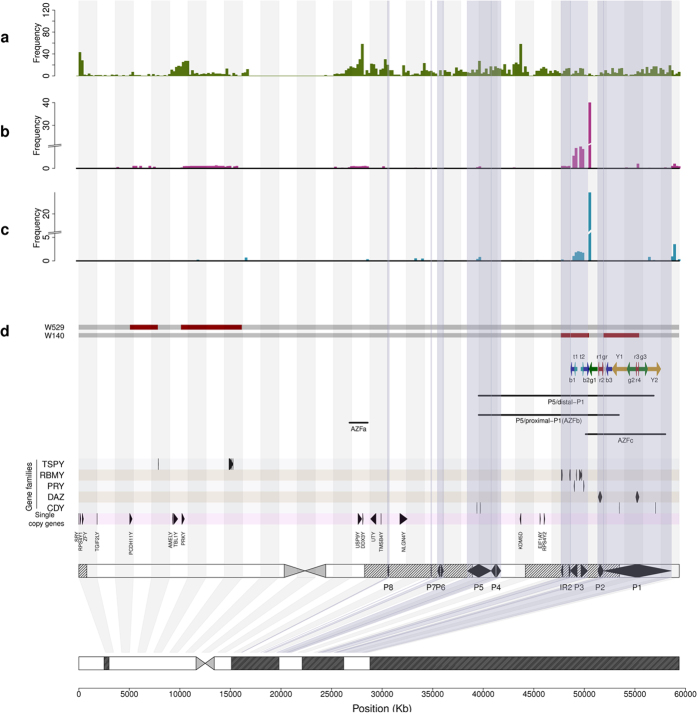
Figure 2. Distributions of the STS markers and deletions in the Y chromosome.
(a) The density distribution of the STS markers targeted in our study and (b) the density distributions of the STS deletions in the NOA patients (c) and the normal group across the Y chromosome. (d) Illustrations of novel deletions from samples w529 and w140. The densities were calculated for every 100 kb window.

