
Figure 4. NOA deletions were enriched near intragenic regions.
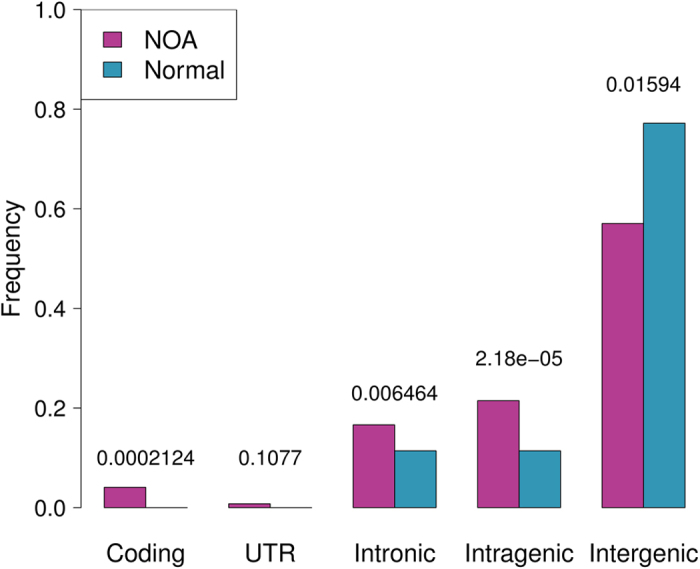
Intragenic regions are a combination of coding, UTR and intronic region, and the p values were calculated by Chi square tests, which were listed on top of the bars.
Official websites use .gov
A
.gov website belongs to an official
government organization in the United States.
Secure .gov websites use HTTPS
A lock (
) or https:// means you've safely
connected to the .gov website. Share sensitive
information only on official, secure websites.
Intragenic regions are a combination of coding, UTR and intronic region, and the p values were calculated by Chi square tests, which were listed on top of the bars.