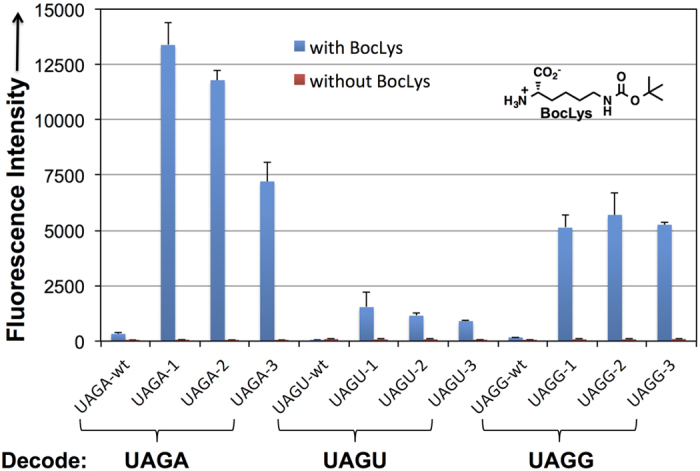
Figure 3. GFPUV fluorescence assays of cells expressing  variants.

Fluorescence readings of E. coli C321.ΔA cells expressing  -wt or the evolved
  mutants, each coexpressed with BocLysRS and corresponding GFPUV-Asn149UAGN. The expressions were conducted either in the presence or in the absence of 5 mM Boc-Lys. Fluorescence intensity was normalized to cell growth. Each data point is the average of triplicate measurements with standard deviation.
