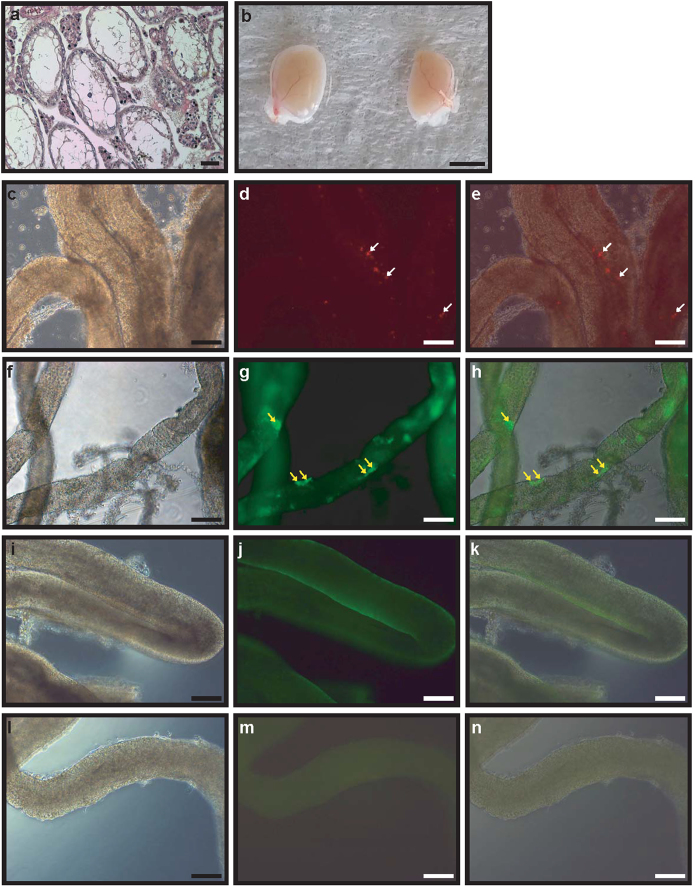
Figure 5. The detection of BM GDC cells after the transplantation of red fluorescent-labelled GDC cells into the seminiferous tubules of germ cell-depleted immunodeficient mice (12 weeks).
Hematoxylin and eosin staining of busulfan-treated immunodeficient mouse testes (a). Red fluorescent-labelled GDC cells from 4-month-old BM testes (b, left testis) and GDC cells with no labelling (b, right testis) were transplanted into the immunodeficient mouse testes. A bright field image (c) and fluorescent image (d) of seminiferous tubules transplanted with red fluorescent-labelled GDC cells are shown. Panel (e) represents the merged image of panels (c,d). Panel (f) represents (a) bright field image, and panel g represents a fluorescent image of seminiferous tubules transplanted with red fluorescent-labelled GDC cells stained with anti-PGP9.5 antibody. Panel (h) is (a) merged image of panels (f,g). Panels (i,j) represent a bright field image (i) and a fluorescent image (j), respectively, of seminiferous tubules stained with anti-PGP9.5 antibody in a control mouse testis. Panels (l,m) show a bright field image (l) and fluorescent image (m), respectively, of seminiferous tubules without anti-PGP9.5 antibody staining in a control mouse testis. Panel (k) shows (a) merged image of panels (i,j) and panel (n) is (a) merged image of panels (l,m). White and yellow arrows indicate red fluorescent-labelled GDC cells and PGP9.5-positive cells, respectively. Scale bars are 50 mm in panel (b). Scale bars are 50 μm and magnification is 100× in panels a and (c–n).

