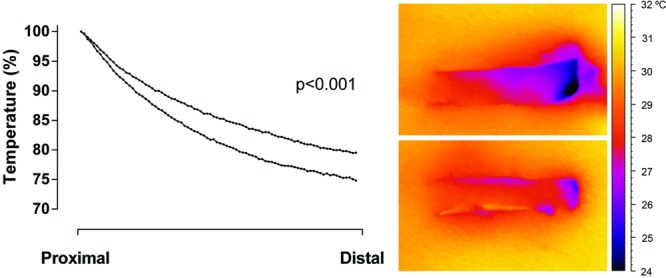
Figure 6.

Thermographic images of 2 random advancement skin flap (1 × 4 cm) on the pig flank, 1 hour after surgery. The upper flap was made thin and the lower flap was made thick. Graph shows the drop in temperature along the length of the flaps (upper curve are thin flaps and lower curve are thick flaps), calculated as percent of a perfusion at a reference point lateral to the flap base (n = 10). Note the lower temperature seen as darkening of the distal end of the flap.
