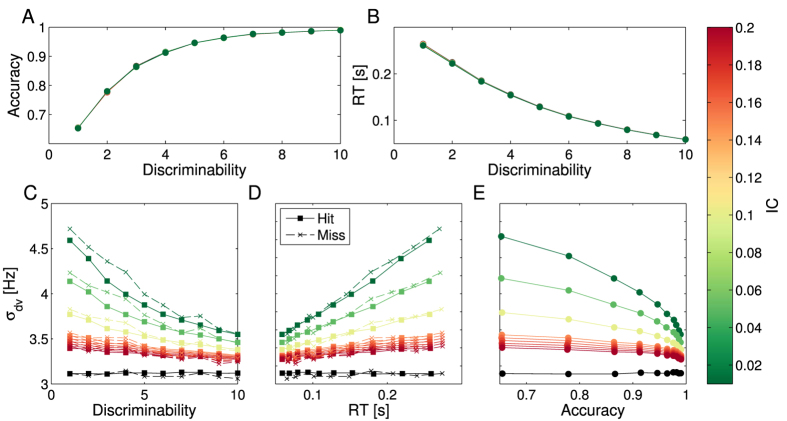
Figure 2. How IC affects σdv’s ability to encode confidence.
(A,B) show the model’s accuracy (i.e. the average correct trials) and response times as a function of stimuli discriminability for several IC values. The different IC values are represented with different colors as shown in the lateral color bar. The black data points are for  . It is clear that different IC values do not affect the relation between these variables. (C–E) show the average σdv for different IC values as a function of discriminability, average RT and average accuracy. In (C,D), square markers indicate averaged values over correct trials and crosses correspond to averaged values over incorrect trials. It is clear that σdv is correlated with discriminability, RT and accuracy for low IC values, and the correlation vanishes for high IC’s. It is also clear that for low discriminabilities, σdv is on average higher, hence confidence will be lower. In C, it is clear that error trials have higher average σdv for all discriminabilities, and thus will be associated with lower confidence reports. However, σdv’s increase in error trials does not affect the functional relation between σdv and RT, as is clear from (D).

